
|
||||||
|

Translation Factor: RSL24D1 (NCBI Gene ID:51187) |
|
 Gene Summary Gene Summary |
| Gene Information | Gene Name: RSL24D1 | Gene ID: 51187 | Gene Symbol | RSL24D1 | Gene ID | 51187 |
| Gene Name | ribosomal L24 domain containing 1 | |
| Synonyms | C15orf15|HRP-L30-iso|L30|RLP24|RPL24|RPL24L|TVAS3 | |
| Cytomap | 15q21.3 | |
| Type of Gene | protein-coding | |
| Description | probable ribosome biogenesis protein RLP2460S ribosomal protein L30 isologhomolog of yeast ribosomal like protein 24my024 proteinribosomal L24 domain-containing protein 1 | |
| Modification date | 20200313 | |
| UniProtAcc | Q9UHA3 | |
| Child GO biological process term(s) under GO:0006412 |
| GO ID | GO term |
| GO:0005840 | Ribosome |
| GO:0006412 | Translation |
| Gene ontology of translaction factor with evidence of Inferred from Direct Assay (IDA) from Entrez |
| Partner | Gene | GO ID | GO term | PubMed ID |
| Inferred gene age of translation factor. |
| Gene | Inferred gene age group among (0 - 67.6], (67.6 - 355.7], (355.7 - 733], (733 - 1119.25], >1119.25 |
| RSL24D1 | >1119.25 |
Top |
|
| We searched PubMed using 'RSL24D1[title] AND translation [title] AND human.' |
| Gene | Title | PMID |
| RSL24D1 | . | . |
Top |
|
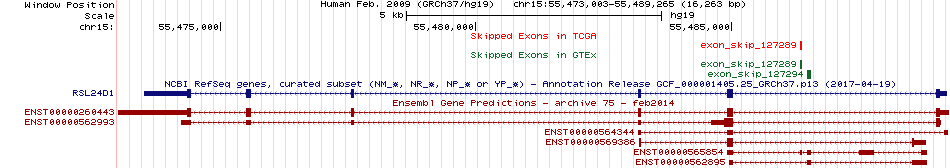
| Skipped exons in TCGA and GTEx based on Ensembl gene isoform structure. * Click on the image to open the UCSC genome browser with custom track showing this image in a new window. For more annotations, please visit our ExonSkipDB. |
 |
| Open reading frame (ORF) analsis of exon skipping events based on Ensembl gene isoform structure. * Click on the break point to see the gene structure around the break point region using the UCSC Genome Browser. |
| ENST | Exon skip start (DNA) | Exon Skip end (DNA) | ORF |
| Exon skipping position in the amino acid sequence. |
| ENST | Exon skip start (DNA) | Exon Skip end (DNA) | Len(transcript seq) | Exon skip start (mRNA) | Exon Skip end (mRNA) | Len(amino acid seq) | Exon skip start (AA) | Exon Skip end (AA) |
| Potentially (partially) lost protein functional features of UniProt. |
| UniProtAcc | Exon skip start (AA) | Exon Skip end (AA) | Function feature start (AA) | Function feature end (AA) | Functional feature type | Functional feature desc. |
Top |
|
| Gene expression level across TCGA pancancer |
 |
| Gene expression level across GTEx pantissue |
 |
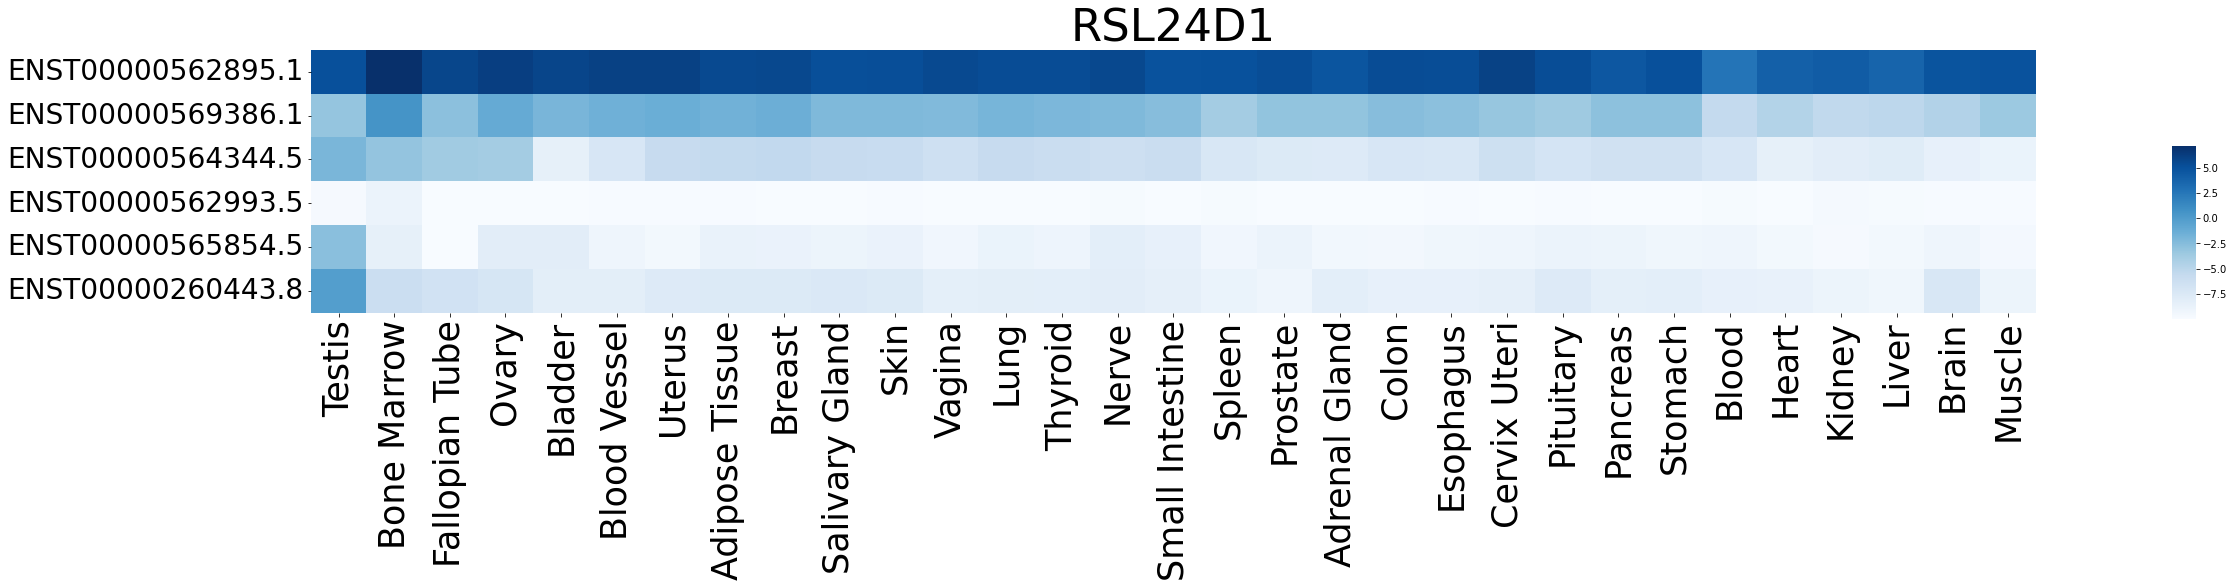
| Expression level of gene isoforms across TCGA pancancer |
 |
| Expression level of gene isoforms across GTEx pantissue |
 |
| Cancer(tissue) type-specific expression level of Translation factor using z-score distriution |
 |
| Differential expression between tumor and matched normal (in the cancer types with more than 10 matched samples) |
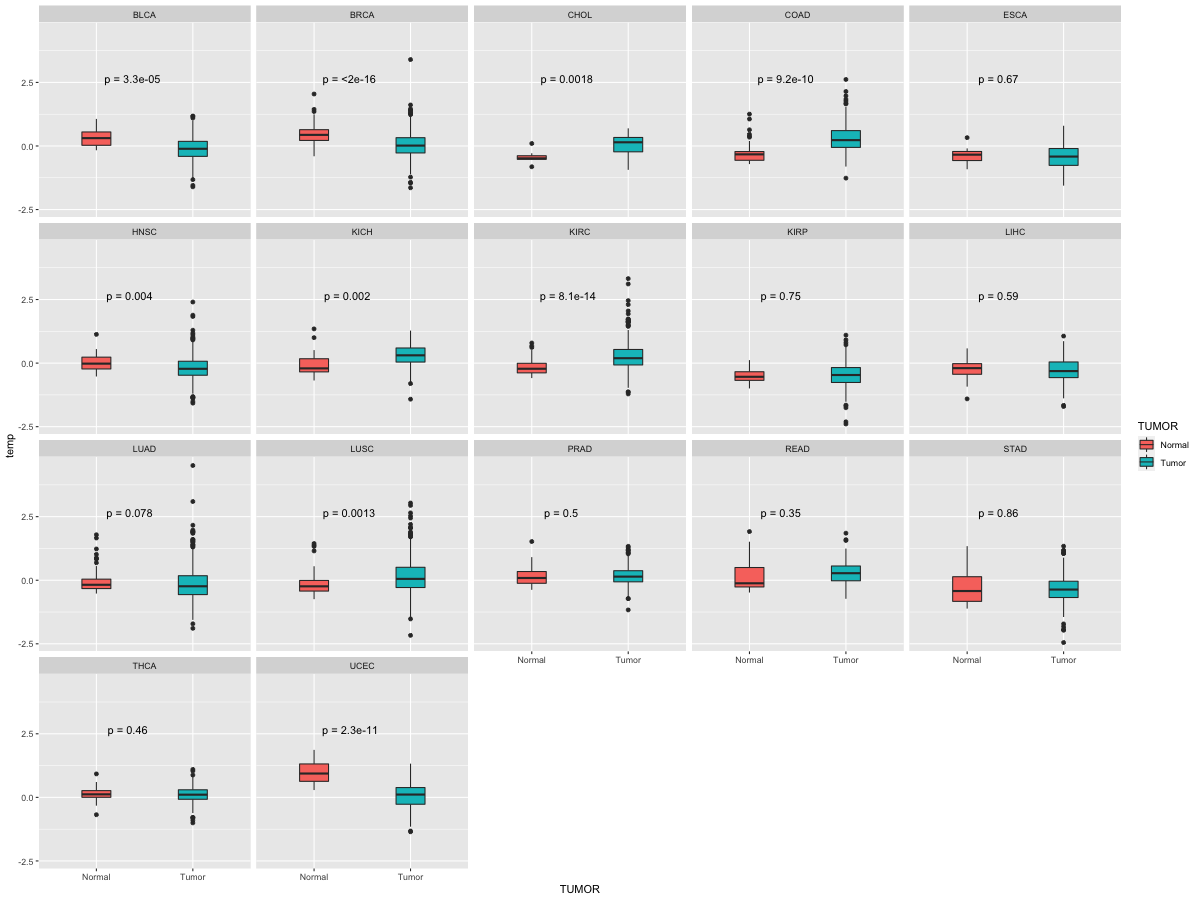 |
| Cancer type | Translation factor | FC | adj.pval |
| STAD | RSL24D1 | 1.2514796224648 | 0.00647870777174831 |
| UCEC | RSL24D1 | -2.84239238228567 | 0.03125 |
| CHOL | RSL24D1 | -4.00898677195008 | 0.0390625 |
| BRCA | RSL24D1 | -3.24064965161136 | 1.7323703104255e-11 |
Top |
|
| Translation factor expression regulation through miRNA binding |
| Cancer type | Gene | miRNA | TargetScan binding score (Context++ score percentile) | Coefficient | Pvalue |
| Translation factor expression regulation through methylation in the promoter of Translation factor |
 |
| Cancer type | Gene | methyl group b | methyl group a | DEG pval | avg methyl in b | avg methyl in a | avg exp in b | avg exp in a |
| Translation factor expression regulation through methylation in the gene body of Translation factor (positive regulation) |
 |
| Cancer type | Gene | methyl group b | methyl group a | DEG pval | avg methyl in b | avg methyl in a | avg exp in b | avg exp in a |
| Translation factor expression regulation through copy number variation of Translation factor |
 |
| Cancer type | Gene | Coefficient | Pvalue |
| BRCA | RSL24D1 | 0.060036907 | 0.044975814 |
Top |
|
| Strongly correlated genes belong to cellular important gene groups with RSL24D1 (coefficient>0.8, pval<0.05, node color based on FC between tumor and matched normal). Significantly associated important genes in the individual cancer types. * Cell metabolism gene: cell metabolism genes from REACTOME (black edge), IUPHAR: drug target genes from IUPHAR (blue edge), Kinase: human kinase genes (brown edge), CGC: cancer gene census genes (orange edge), TSG: tumor suppresor genes (purple edge), Epifactor: epigenetic factors (light blue edge), TF: transcription factors (green) |
 |
| Cancer type | Gene group | Translation factor | Correlated gene | Coefficient | Pvalue |
| COAD | TSG | RSL24D1 | COPS2 | 0.808724493 | 2.33E-77 |
| GBM | Cell metabolism gene | RSL24D1 | PFDN5 | 0.800934679 | 1.03E-39 |
| SKCM | TF | RSL24D1 | ZNF280D | 0.814351662 | 1.33E-113 |
| SKCM | TSG | RSL24D1 | COPS2 | 0.804577627 | 6.81E-109 |
| THYM | CGC | RSL24D1 | NACA | 0.816321232 | 2.20E-30 |
| UCS | CGC | RSL24D1 | NACA | 0.816321232 | 2.20E-30 |
| UVM | Cell metabolism gene | RSL24D1 | DUT | 0.810915306 | 7.77E-20 |
| UVM | TF | RSL24D1 | ZNF354A | 0.802902769 | 3.33E-19 |
| UVM | TF | RSL24D1 | ZNF277 | 0.803596227 | 2.94E-19 |
| UVM | TF | RSL24D1 | ZNF280D | 0.82260617 | 8.17E-21 |
| UVM | TSG | RSL24D1 | COPS2 | 0.860286357 | 1.57E-24 |
Top |
|
| Protein 3D structure Visit iCn3D. |
Top |
|
| Protein-protein interaction networks * Overlap between up-regulated DEGs (log2FC<-1 and adj.P<0.05) and STRING PPI network (center: Translation factor, node: DEGs, edges: weighted by -log2(adj.P)) |
 |
| Overlap between down-regulated DEGs (log2FC>1 and adj.P<0.05) and STRING PPI network (center: Translation factor, node: DEGs, edges: weighted by -log2(adj.P)) |
 |
 * Edge colors based on TCGA cancer types. |
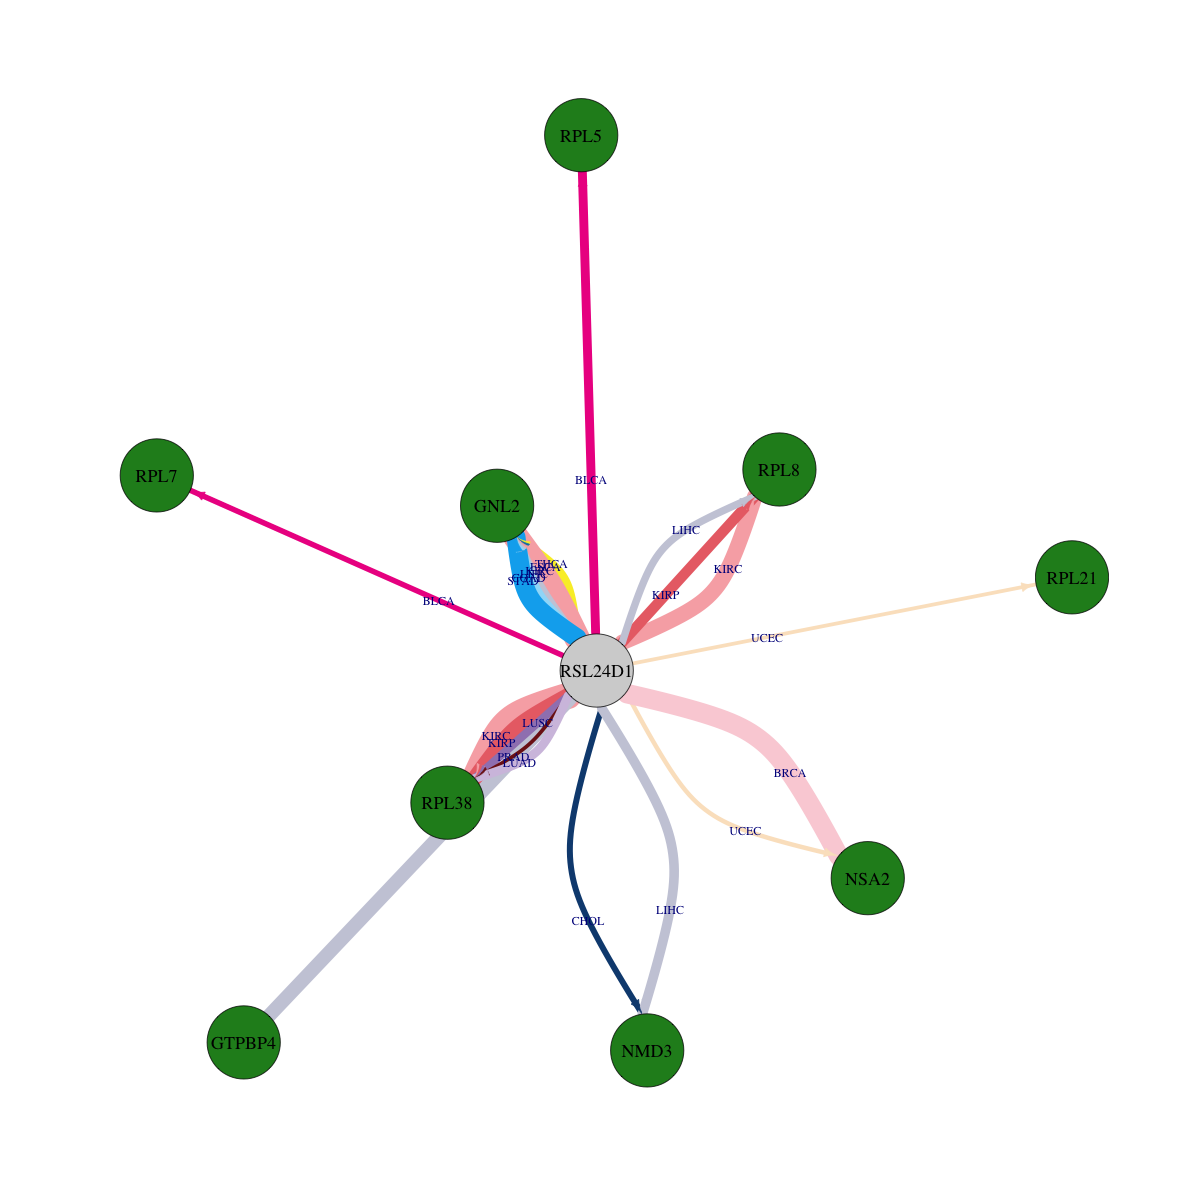
| * Overlap between DEGs (log2FC>1 and adj.P<0.05) and STRING PPI network per cancer (center: Translation factor, node: DEGs, node color: log2FC, edges: weighted by -log2(adj.P)) |
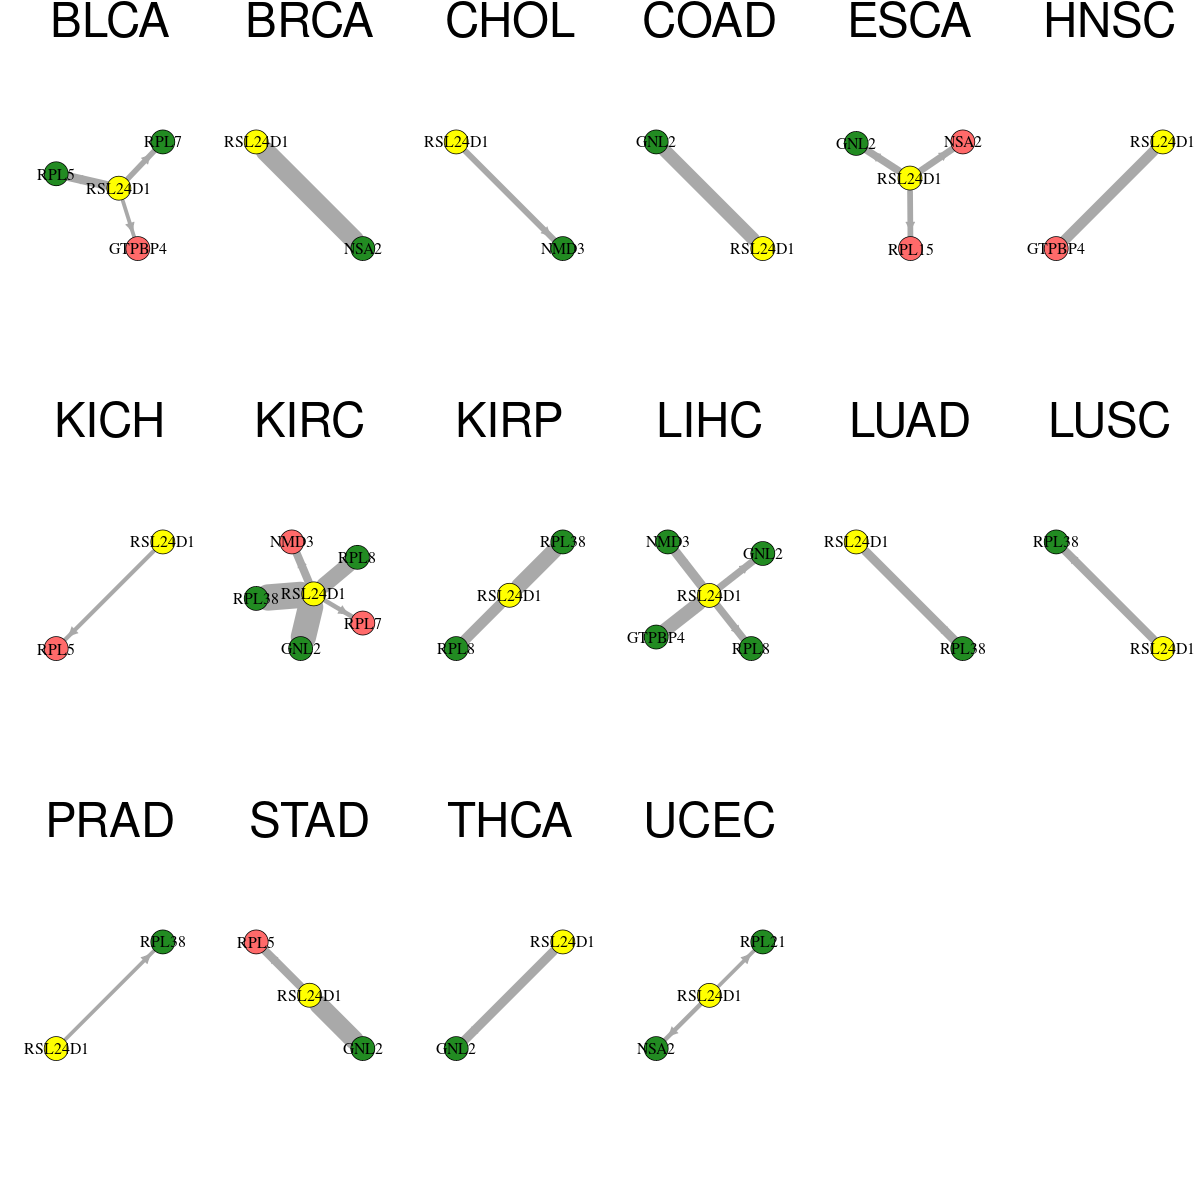 |
| Cancer type | Translation factor | Interacting protein coding gene | FC | adj.pval |
| LIHC | RSL24D1 | NMD3 | -1.37228657083066 | 0.000137265065605683 |
| THCA | RSL24D1 | GNL2 | -1.16529435766043 | 0.000244140528829603 |
| LUAD | RSL24D1 | RPL38 | -1.66722943744988 | 0.000257795914027732 |
| BLCA | RSL24D1 | RPL5 | -3.50581551367555 | 0.00026702880859375 |
| STAD | RSL24D1 | RPL5 | 2.24361928856279 | 0.000433447770774365 |
| LUSC | RSL24D1 | RPL38 | -2.00110253296947 | 0.00049723236196648 |
| KIRC | RSL24D1 | NMD3 | 1.42972481111117 | 0.000552342824201752 |
| ESCA | RSL24D1 | GNL2 | -2.90647526338419 | 0.0009765625 |
| LIHC | RSL24D1 | RPL8 | -4.84588284974558 | 0.00110314154326131 |
| LIHC | RSL24D1 | GNL2 | -4.17682857122964 | 0.00135114801221843 |
| ESCA | RSL24D1 | NSA2 | 2.19480328019754 | 0.001953125 |
| CHOL | RSL24D1 | NMD3 | -4.91333963004969 | 0.00390625 |
| ESCA | RSL24D1 | RPL15 | 1.76629417535644 | 0.0048828125 |
| BLCA | RSL24D1 | RPL7 | -1.69452794362008 | 0.0061798095703125 |
| KIRC | RSL24D1 | RPL7 | 1.54848456068043 | 0.0138655597925316 |
| UCEC | RSL24D1 | NSA2 | -2.81369532981968 | 0.015625 |
| KICH | RSL24D1 | RPL5 | 1.79380241489629 | 0.0219083428382874 |
| BLCA | RSL24D1 | GTPBP4 | 1.58690285996278 | 0.0289306640625 |
| UCEC | RSL24D1 | RPL21 | -4.78950178238333 | 0.03125 |
| PRAD | RSL24D1 | RPL38 | -1.37307294389303 | 0.0319785302138518 |
| BRCA | RSL24D1 | NSA2 | -1.68478905261304 | 1.44885490954951e-08 |
| LIHC | RSL24D1 | GTPBP4 | -1.61937717479796 | 2.46746298874691e-06 |
| STAD | RSL24D1 | GNL2 | -2.160457951545 | 2.56113708019257e-08 |
| KIRC | RSL24D1 | RPL38 | -2.47198269993031 | 2.66680331214666e-11 |
| KIRP | RSL24D1 | RPL38 | -2.05925877790715 | 4.97791916131974e-07 |
| COAD | RSL24D1 | GNL2 | -4.21306742273585 | 5.03659248352051e-06 |
| KIRC | RSL24D1 | RPL8 | -1.18252459971773 | 5.64962994208288e-07 |
| KIRP | RSL24D1 | RPL8 | -1.53003692350119 | 6.0301274061203e-05 |
| KIRC | RSL24D1 | GNL2 | -1.62141805150761 | 6.61195389686645e-11 |
| HNSC | RSL24D1 | GTPBP4 | 2.02268965512305 | 6.75183794101032e-05 |
| Protein-protein interactors with this translation factor (BIOGRID-3.4.160) |
| PPI interactors with RSL24D1 |
| DNMT3L, ELAVL1, CAND1, MRTO4, CDC23, FAM9B, NSA2, NPM1, PRR11, RBM4B, FBL, IFI16, EWSR1, CNBP, PPAN, FGF3, MAGEB10, MAK16, WDR46, CPNE4, RRP8, RPL37A, RPL30, FOXA1, MCPH1, PEA15, FBXO7, ESR2, RECQL4, RPS6, NR2C2, HIST1H4A, TRIM28, SNIP1, ORF14, KIF14, RASGRF2, MKI67, ORF4a, ATG10, RPL36, LIN28A, RPL15, KRR1, SRSF6, ZNF467, RPL7L1, SRSF5, RPL11, LYAR, PNMAL1, ADARB1, RPL23A, RNF151, HIST1H2AM, RPL4, ABT1, ZNF346, RPL10, ZNF574, RPL28, SRSF1, RPL35, RPLP0, ZC3H3, H1FNT, IL17B, MYBBP1A, ZC3H10, RPL19, RPS8, NPM3, PRKRA, DGCR8, PURG, HIST1H1A, RPL13, ZNF524, RPL13A, ZNF668, MAGEB2, RPL14, RPL3, FGFBP1, NEIL1, RPL8, RPS10, SURF6, RBM28, HIST1H1E, RPL31, RPL7A, |
Top |
|
| Clinically associated variants from ClinVar. |
| Gene | Chr | Position | RefSeq | VarSeq | RefSeeq | VarType | Pathogenic | Disease | VarInfo |
| nsSNVs with sample frequency (size of circle) from TCGA 33 cancers. |
 |
| SNVs and Indels |
| Gene | Cancer type | Chromosome | Start | End | RefSeeq | MutSeq | Mutation type | AAchange | # samples |
| RSL24D1 | PAAD | chr15 | 55483181 | 55483181 | T | A | Missense_Mutation | p.N87I | 3 |
| RSL24D1 | UCEC | chr15 | 55477572 | 55477572 | A | C | Missense_Mutation | p.F107C | 2 |
| RSL24D1 | LUAD | chr15 | 55489023 | 55489023 | G | A | Silent | p.V22V | 2 |
| RSL24D1 | PAAD | chr15 | 55483181 | 55483181 | T | A | Missense_Mutation | 2 | |
| RSL24D1 | CESC | chr15 | 55489063 | 55489063 | C | G | Missense_Mutation | 2 | |
| RSL24D1 | SARC | chr15 | 55483213 | 55483213 | A | G | Silent | 2 | |
| RSL24D1 | SKCM | chr15 | 55475591 | 55475591 | T | C | Missense_Mutation | p.K114E | 2 |
| RSL24D1 | LIHC | chr15 | 55475581 | 55475581 | T | C | Missense_Mutation | 2 | |
| RSL24D1 | LIHC | chr15 | 55475581 | 55475581 | T | C | Missense_Mutation | p.E117G | 1 |
| RSL24D1 | LIHC | chr15 | 55475521 | 55475521 | G | - | Frame_Shift_Del | p.P137fs | 1 |
| RSL24D1 | BLCA | chr15 | 55489079 | 55489079 | C | T | Missense_Mutation | 1 | |
| RSL24D1 | OV | chr15 | 55475541 | 55475541 | G | A | Silent | p.N130N | 1 |
| RSL24D1 | CESC | chr15 | 55489065 | 55489065 | G | A | Silent | 1 | |
| RSL24D1 | CESC | chr15 | 55489063 | 55489063 | C | G | Missense_Mutation | p.C9S | 1 |
| RSL24D1 | COAD | chr15 | 55474401 | 55474401 | C | A | Missense_Mutation | p.E147D | 1 |
| RSL24D1 | SARC | chr15 | 55483213 | 55483213 | A | G | Silent | p.N76N | 1 |
| RSL24D1 | HNSC | chr15 | 55484953 | 55484953 | C | T | Missense_Mutation | 1 | |
| RSL24D1 | SARC | chr15 | 55483213 | 55483213 | A | G | Silent | p.N76 | 1 |
| RSL24D1 | HNSC | chr15 | 55484953 | 55484953 | C | T | Missense_Mutation | p.A54T | 1 |
| Copy number variation (CNV) of RSL24D1 * Click on the image to open the original image in a new window. |
 |
| Fusion gene breakpoints (product of the structural variants (SVs)) across RSL24D1 * Click on the image to open the UCSC genome browser with custom track showing this image in a new window. |
 |
| Fusion genes with this translation factor from FusionGDB2.0. |
| FusionGDB2 ID | Disease | Sample | Hgene | Hchr | Hbp | Hstrand | Tgene | Tchr | Tbp | Tstrand |
| 89309 | N/A | AX381147 | AKAP13 | chr15 | 86109882 | + | RSL24D1 | chr15 | 55473516 | + |
| 89309 | N/A | AX381518 | MBD2 | chr18 | 51687011 | - | RSL24D1 | chr15 | 55473512 | + |
| 101835 | N/A | AA528426 | RSL24D1 | chr15 | 55473512 | - | C2CD2 | chr21 | 43349201 | + |
| 97555 | N/A | FN081792 | RSL24D1 | chr15 | 55473983 | + | CCDC13 | chr3 | 42761754 | + |
| 78431 | N/A | AV681582 | RSL24D1 | chr15 | 55473515 | - | CPXM2 | chr10 | 125607186 | + |
| 97753 | N/A | BI858638 | RSL24D1 | chr15 | 55473512 | - | MSRA | chr8 | 10247279 | - |
| 102311 | N/A | H89566 | RSL24D1 | chr15 | 55473516 | - | PARD3 | chr10 | 35023824 | + |
| 85228 | LUAD | TCGA-44-7660-01A | RSL24D1 | chr15 | 55489008 | - | RAB27A | chr15 | 55527154 | - |
| 85228 | LUSC | TCGA-37-4132 | RSL24D1 | chr15 | 55489008 | - | RAB27A | chr15 | 55497903 | - |
| 89316 | N/A | DN919393 | TBC1D22A | chr22 | 47397340 | - | RSL24D1 | chr15 | 55473515 | + |
Top |
|
| Kaplan-Meier plots with logrank tests of overall survival (OS) |
 |
| Cancer type | Translation factor | Coefficent | Hazard ratio | Wald test pval | Likelihool ratio pval | Logrank test pval | # samples |
Top |
|
| Differential gene expression between female and male. (Wilcoxon test, pval<0.05) |
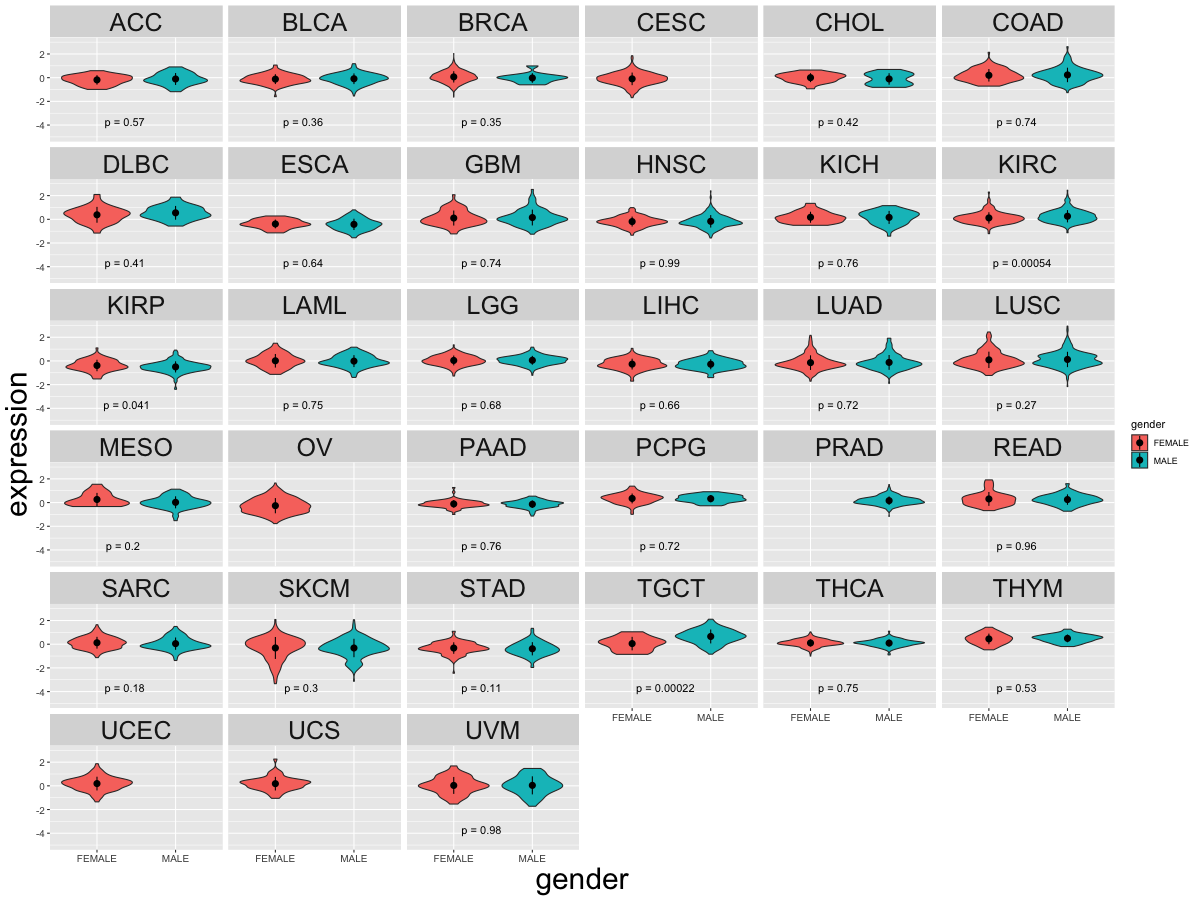 |
| Cancer type | Translation factor | pval | adj.p |
| TGCT | RSL24D1 | 0.000218358507325036 | 0.0061 |
| KIRC | RSL24D1 | 0.000391348547846366 | 0.011 |
| KIRP | RSL24D1 | 0.0411359693695403 | 1 |
Top |
|
| Differential gene expression between young and old age groups (Wilcoxon test, pval<0.05) |
 |
| Cancer type | Translation factor | pval | adj.p |
| TGCT | RSL24D1 | 0.00599847180443323 | 0.2 |
| LUSC | RSL24D1 | 0.0492775760581933 | 1 |
| UCEC | RSL24D1 | 0.0433198266997519 | 1 |
| CHOL | RSL24D1 | 0.0408991569275669 | 1 |
Top |
|
| Drugs targeting genes involved in this translation factor. (DrugBank Version 5.1.8 2021-05-08) |
| UniProtAcc | DrugBank ID | Drug name | Drug activity | Drug type | Drug status |
Top |
|
| Diseases associated with this translation factor. (DisGeNet 4.0) |
| Disease ID | Disease Name | # PubMeds | Disease source |
(UTHealth)
Web File Viewing | Emergency Information |Campus Carry|Site Policies