
|
||||||
|

Translation Factor: MRPS33 (NCBI Gene ID:51650) |
|
 Gene Summary Gene Summary |
| Gene Information | Gene Name: MRPS33 | Gene ID: 51650 | Gene Symbol | MRPS33 | Gene ID | 51650 |
| Gene Name | mitochondrial ribosomal protein S33 | |
| Synonyms | CGI-139|MRP-S33|PTD003|S33mt | |
| Cytomap | 7q34 | |
| Type of Gene | protein-coding | |
| Description | 28S ribosomal protein S33, mitochondrialmitochondrial small ribosomal subunit protein mS33 | |
| Modification date | 20200313 | |
| UniProtAcc | Q9Y291 | |
| Child GO biological process term(s) under GO:0006412 |
| GO ID | GO term |
| GO:0005840 | Ribosome |
| GO:0006412 | Translation |
| Gene ontology of translaction factor with evidence of Inferred from Direct Assay (IDA) from Entrez |
| Partner | Gene | GO ID | GO term | PubMed ID |
| Inferred gene age of translation factor. |
| Gene | Inferred gene age group among (0 - 67.6], (67.6 - 355.7], (355.7 - 733], (733 - 1119.25], >1119.25 |
| MRPS33 | (733 - 1119.25] |
Top |
|
| We searched PubMed using 'MRPS33[title] AND translation [title] AND human.' |
| Gene | Title | PMID |
| MRPS33 | . | . |
Top |
|
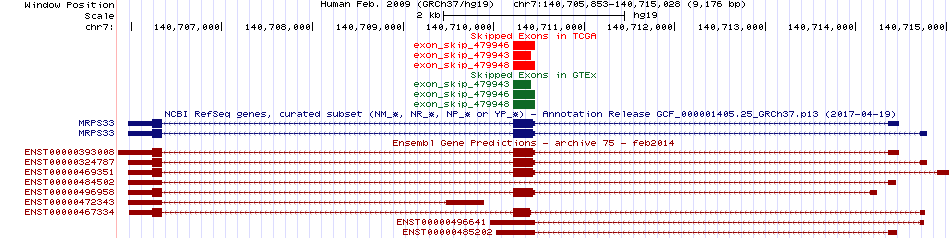
| Skipped exons in TCGA and GTEx based on Ensembl gene isoform structure. * Click on the image to open the UCSC genome browser with custom track showing this image in a new window. For more annotations, please visit our ExonSkipDB. |
 |
| Open reading frame (ORF) analsis of exon skipping events based on Ensembl gene isoform structure. * Click on the break point to see the gene structure around the break point region using the UCSC Genome Browser. |
| ENST | Exon skip start (DNA) | Exon Skip end (DNA) | ORF |
| ENST00000324787 | 140710218 | 140710460 | 3UTR-3CDS |
| ENST00000496958 | 140710218 | 140710460 | 3UTR-3CDS |
| Exon skipping position in the amino acid sequence. |
| ENST | Exon skip start (DNA) | Exon Skip end (DNA) | Len(transcript seq) | Exon skip start (mRNA) | Exon Skip end (mRNA) | Len(amino acid seq) | Exon skip start (AA) | Exon Skip end (AA) |
| Potentially (partially) lost protein functional features of UniProt. |
| UniProtAcc | Exon skip start (AA) | Exon Skip end (AA) | Function feature start (AA) | Function feature end (AA) | Functional feature type | Functional feature desc. |
Top |
|
| Gene expression level across TCGA pancancer |
 |
| Gene expression level across GTEx pantissue |
 |
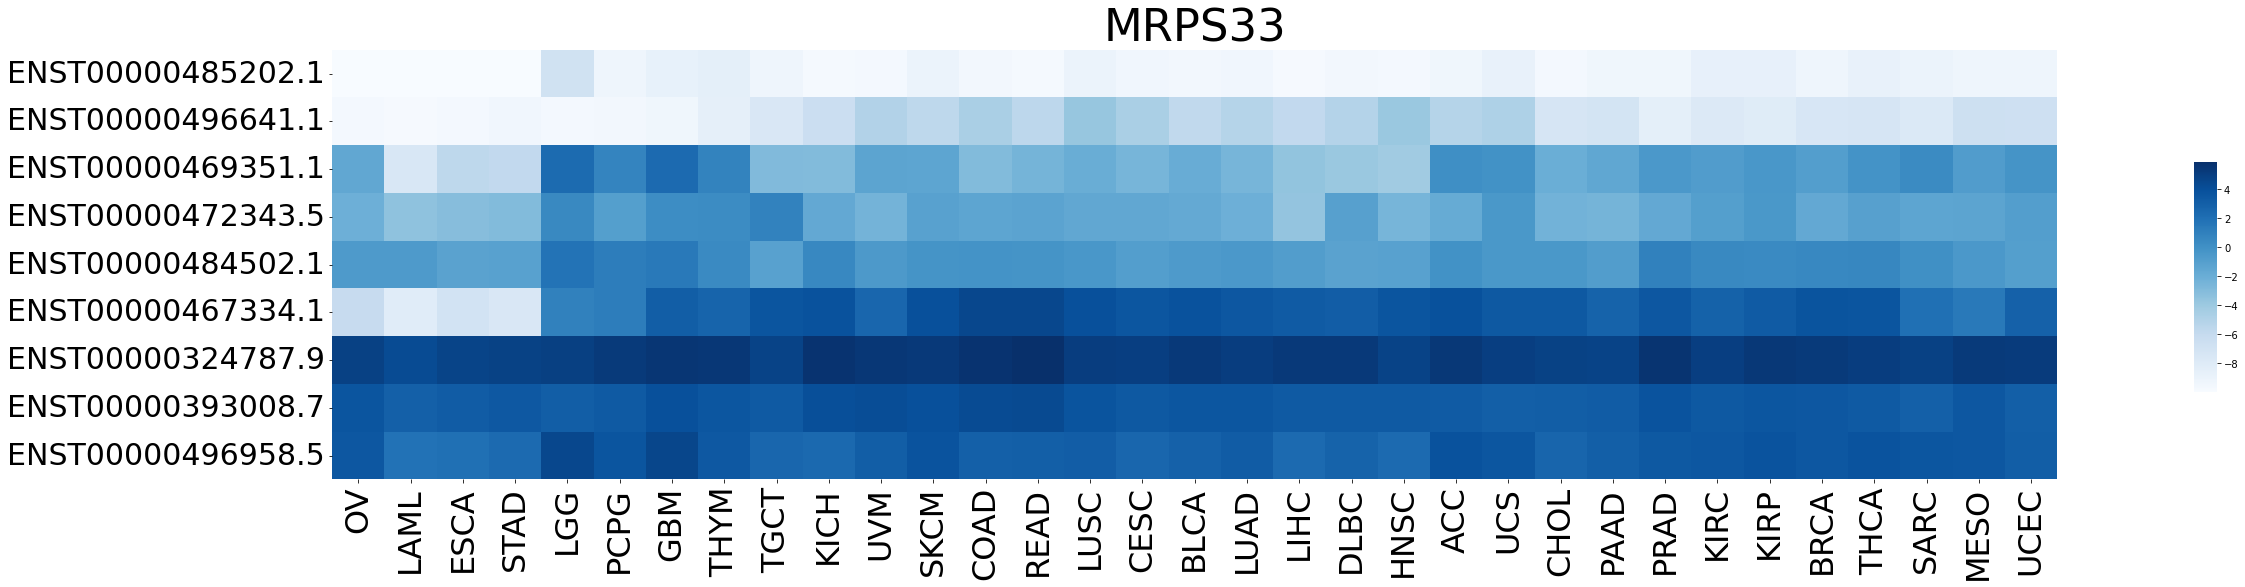
| Expression level of gene isoforms across TCGA pancancer |
 |
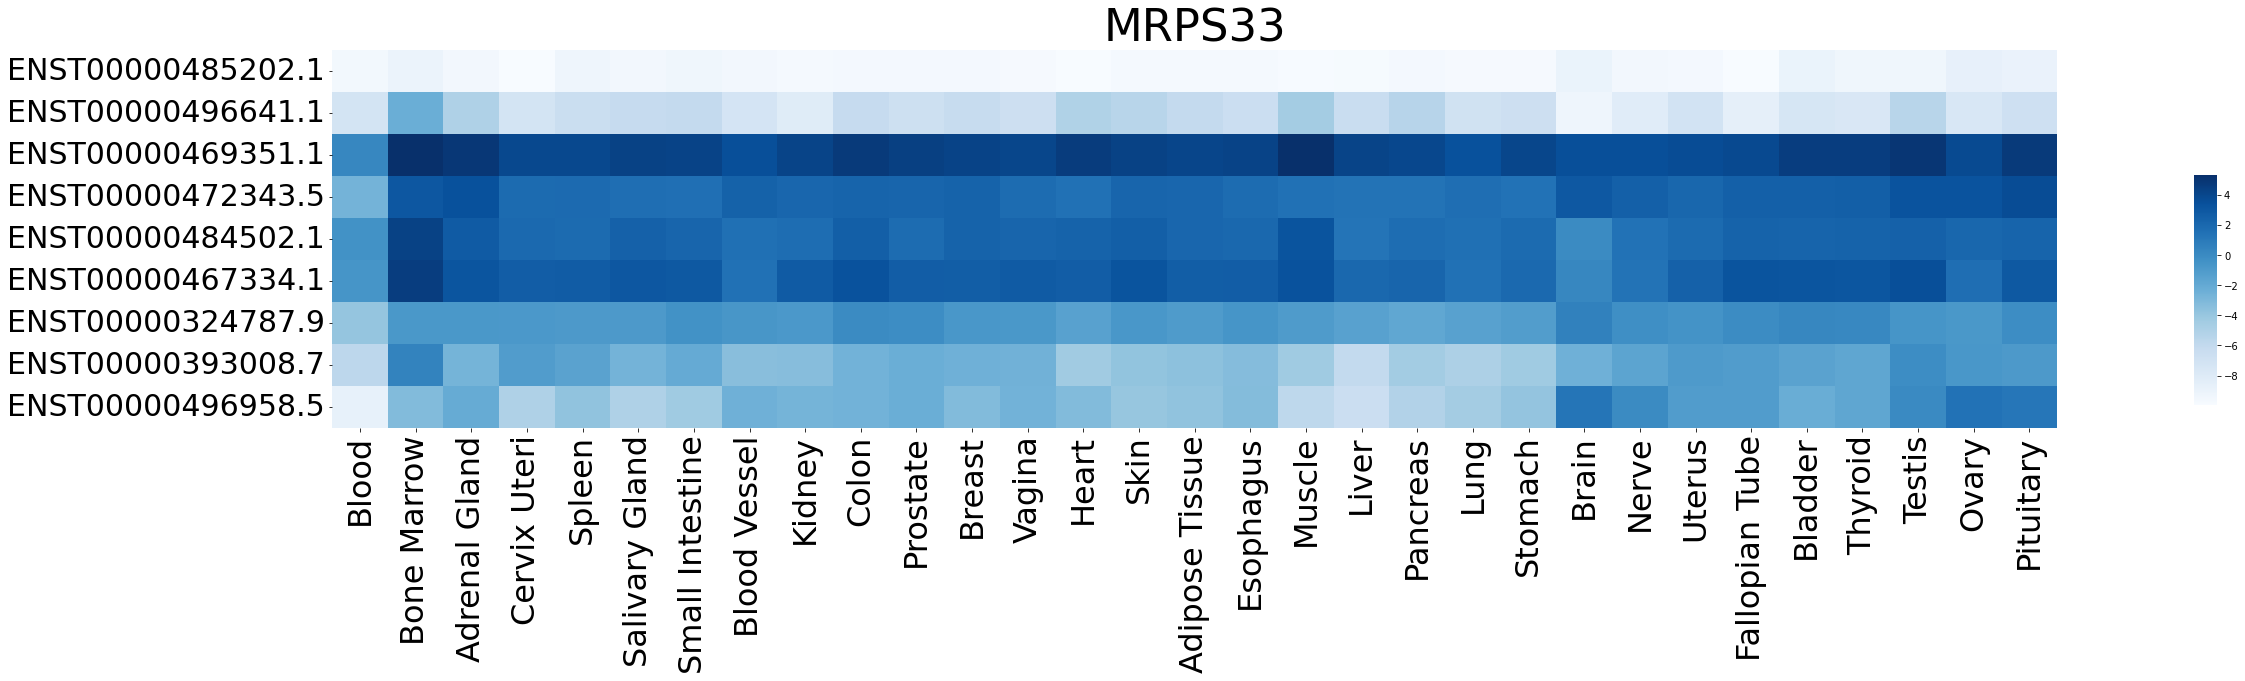
| Expression level of gene isoforms across GTEx pantissue |
 |
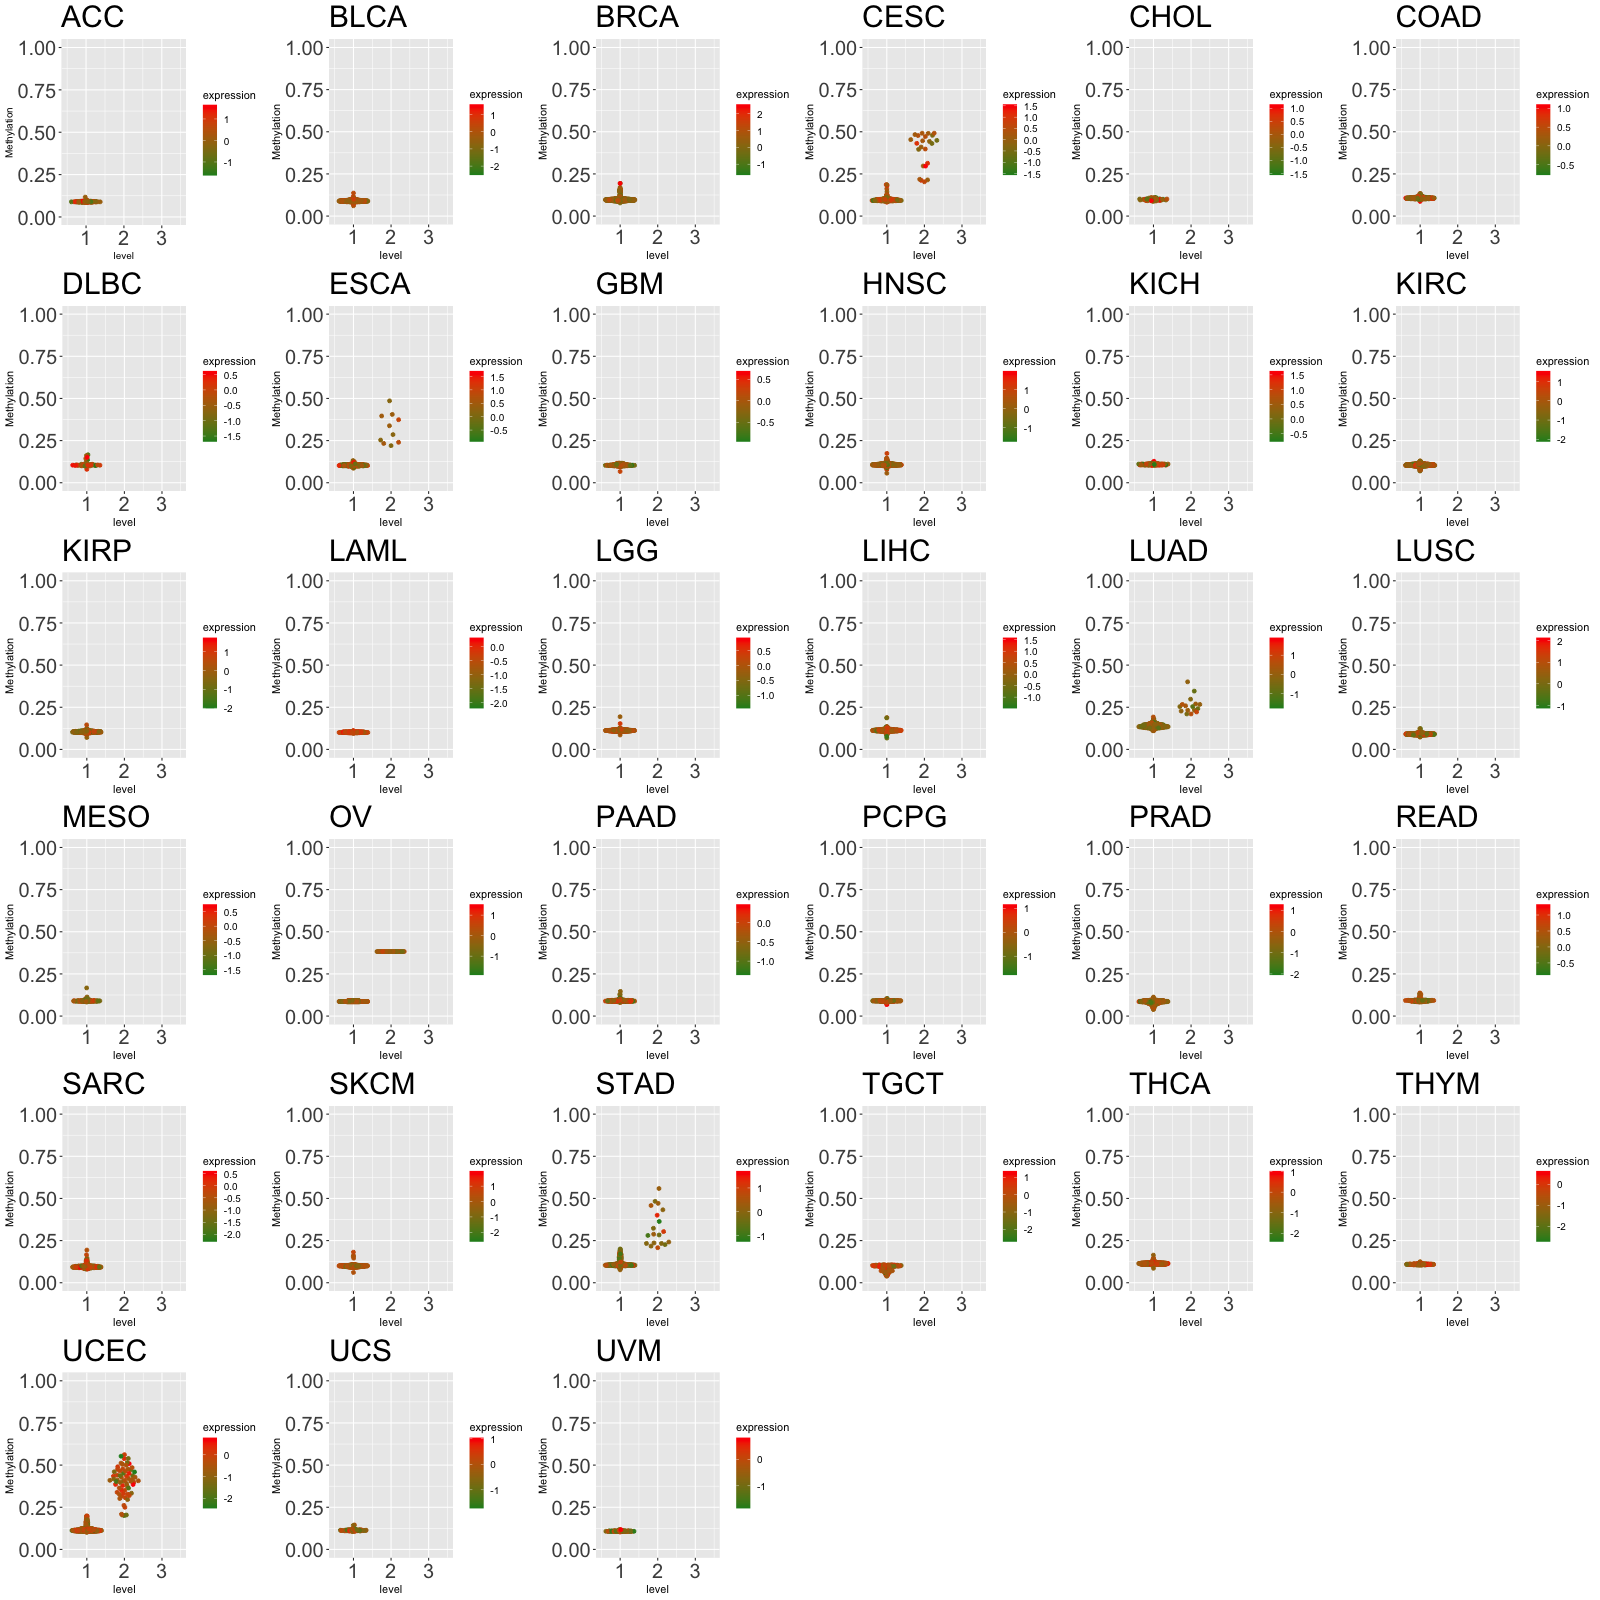
| Cancer(tissue) type-specific expression level of Translation factor using z-score distriution |
 |
| Differential expression between tumor and matched normal (in the cancer types with more than 10 matched samples) |
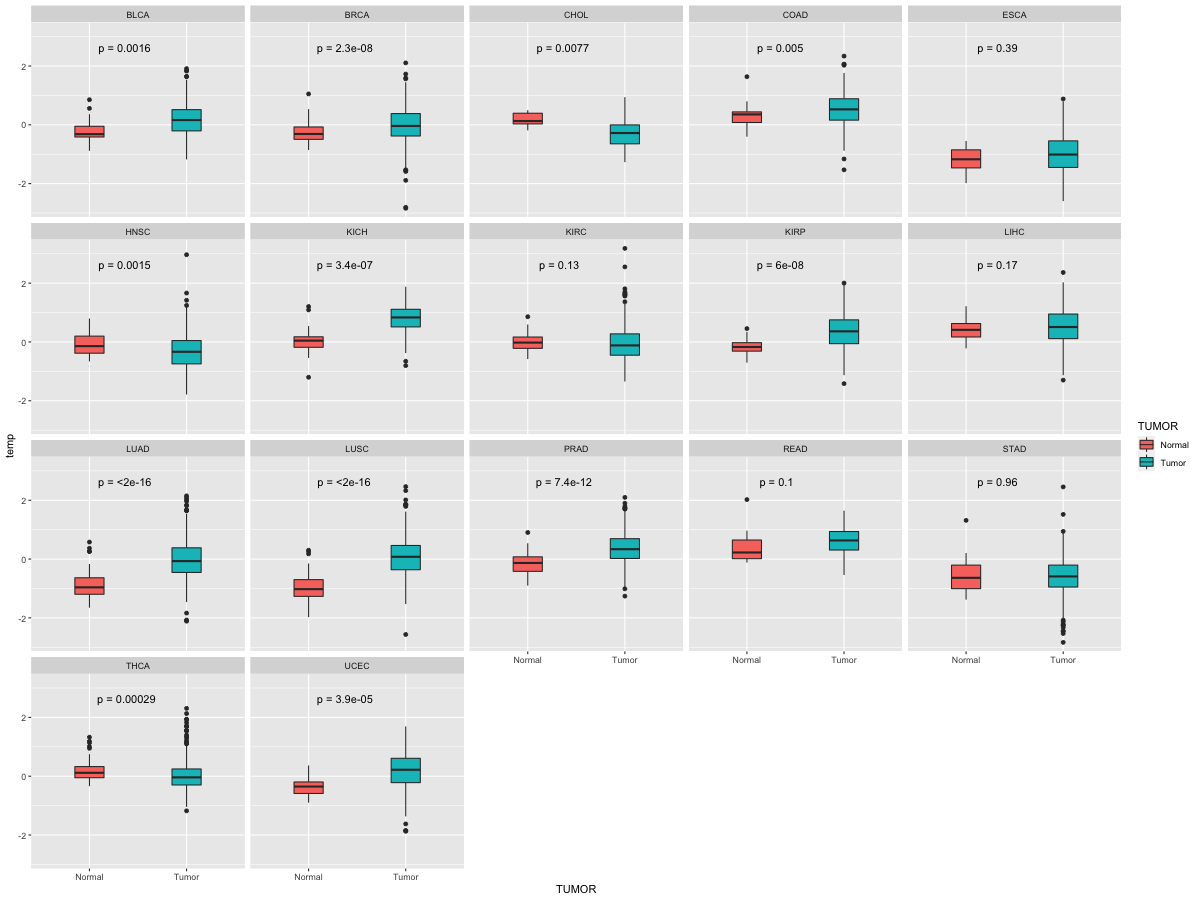 |
| Cancer type | Translation factor | FC | adj.pval |
| BRCA | MRPS33 | -2.50367423576272 | 0.000154377851145473 |
| LUSC | MRPS33 | -3.32702669971865 | 5.71093314566242e-07 |
Top |
|
| Translation factor expression regulation through miRNA binding |
| Cancer type | Gene | miRNA | TargetScan binding score (Context++ score percentile) | Coefficient | Pvalue |
| Translation factor expression regulation through methylation in the promoter of Translation factor |
 |
| Cancer type | Gene | methyl group b | methyl group a | DEG pval | avg methyl in b | avg methyl in a | avg exp in b | avg exp in a |
| Translation factor expression regulation through methylation in the gene body of Translation factor (positive regulation) |
 |
| Cancer type | Gene | methyl group b | methyl group a | DEG pval | avg methyl in b | avg methyl in a | avg exp in b | avg exp in a |
| Translation factor expression regulation through copy number variation of Translation factor |
 |
| Cancer type | Gene | Coefficient | Pvalue |
| SARC | MRPS33 | 0.432235126 | 0.000167654 |
| BLCA | MRPS33 | -0.072089975 | 0.005176046 |
| LGG | MRPS33 | 0.091237567 | 0.049320517 |
Top |
|
| Strongly correlated genes belong to cellular important gene groups with MRPS33 (coefficient>0.8, pval<0.05, node color based on FC between tumor and matched normal). Significantly associated important genes in the individual cancer types. * Cell metabolism gene: cell metabolism genes from REACTOME (black edge), IUPHAR: drug target genes from IUPHAR (blue edge), Kinase: human kinase genes (brown edge), CGC: cancer gene census genes (orange edge), TSG: tumor suppresor genes (purple edge), Epifactor: epigenetic factors (light blue edge), TF: transcription factors (green) |
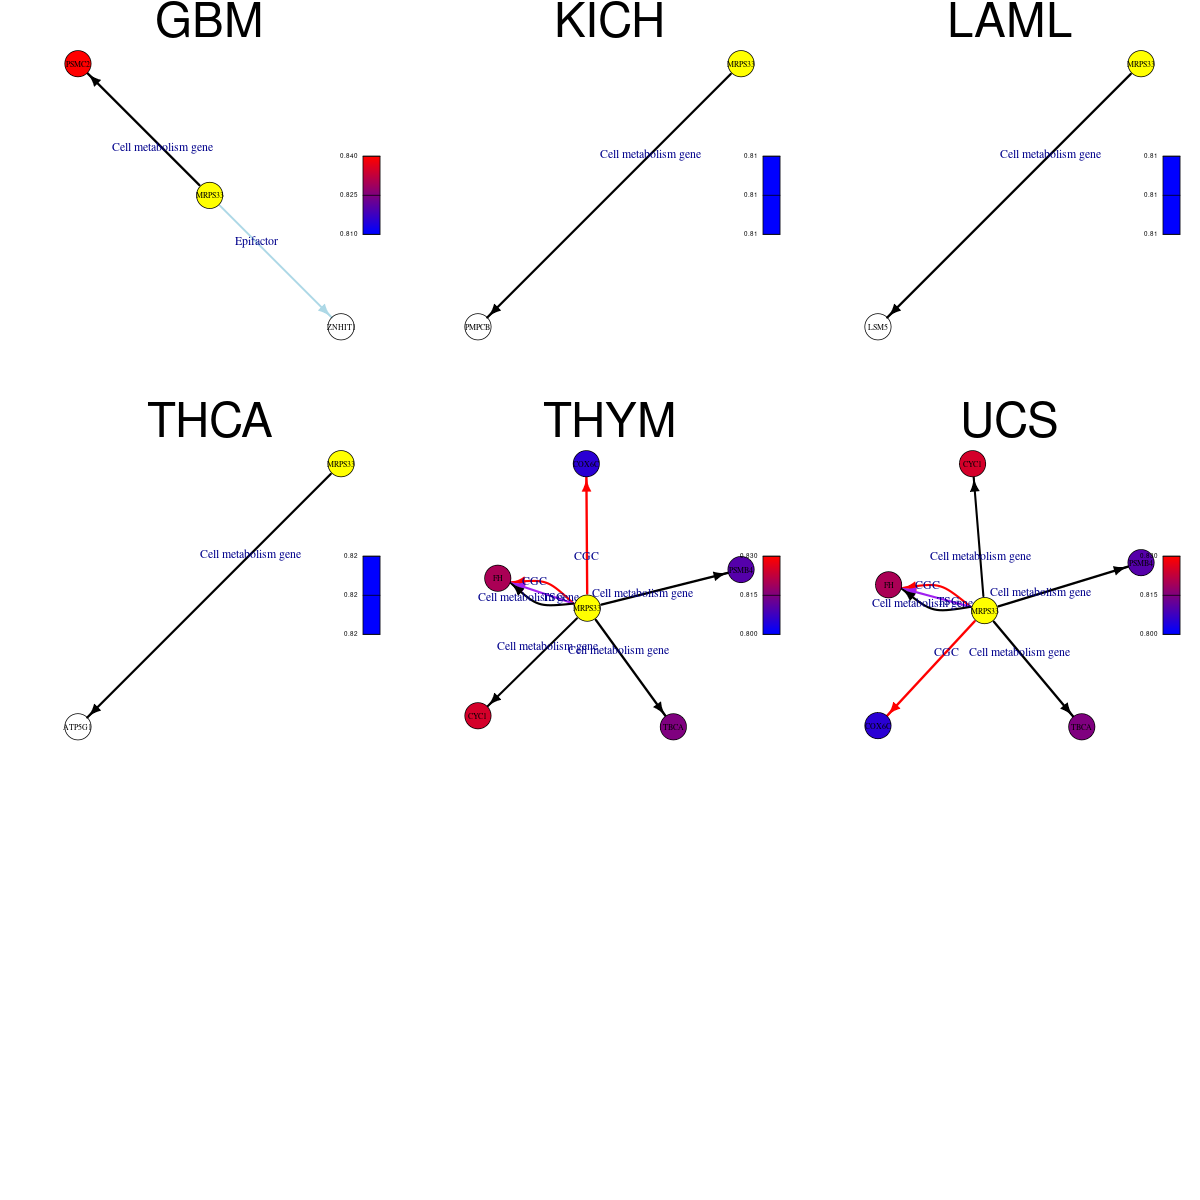 |
| Cancer type | Gene group | Translation factor | Correlated gene | Coefficient | Pvalue |
| GBM | Cell metabolism gene | MRPS33 | PSMC2 | 0.806517717 | 1.19E-40 |
| GBM | Epifactor | MRPS33 | ZNHIT1 | 0.836394487 | 2.97E-46 |
| KICH | Cell metabolism gene | MRPS33 | PMPCB | 0.814337983 | 9.64E-23 |
| LAML | Cell metabolism gene | MRPS33 | LSM5 | 0.808366483 | 3.35E-41 |
| THCA | Cell metabolism gene | MRPS33 | ATP5G1 | 0.815611338 | 1.47E-137 |
| THYM | Cell metabolism gene | MRPS33 | PSMB4 | 0.804990976 | 5.57E-29 |
| THYM | Cell metabolism gene | MRPS33 | TBCA | 0.805534274 | 4.79E-29 |
| THYM | Cell metabolism gene | MRPS33 | FH | 0.820275288 | 6.77E-31 |
| THYM | Cell metabolism gene | MRPS33 | CYC1 | 0.825098837 | 1.54E-31 |
| THYM | CGC | MRPS33 | COX6C | 0.802806779 | 1.01E-28 |
| THYM | CGC | MRPS33 | FH | 0.820275288 | 6.77E-31 |
| THYM | TSG | MRPS33 | FH | 0.820275288 | 6.77E-31 |
| UCS | Cell metabolism gene | MRPS33 | PSMB4 | 0.804990976 | 5.57E-29 |
| UCS | Cell metabolism gene | MRPS33 | TBCA | 0.805534274 | 4.79E-29 |
| UCS | Cell metabolism gene | MRPS33 | FH | 0.820275288 | 6.77E-31 |
| UCS | Cell metabolism gene | MRPS33 | CYC1 | 0.825098837 | 1.54E-31 |
| UCS | CGC | MRPS33 | COX6C | 0.802806779 | 1.01E-28 |
| UCS | CGC | MRPS33 | FH | 0.820275288 | 6.77E-31 |
| UCS | TSG | MRPS33 | FH | 0.820275288 | 6.77E-31 |
Top |
|
| Protein 3D structure Visit iCn3D. |
Top |
|
| Protein-protein interaction networks * Overlap between up-regulated DEGs (log2FC<-1 and adj.P<0.05) and STRING PPI network (center: Translation factor, node: DEGs, edges: weighted by -log2(adj.P)) |
 |
| Overlap between down-regulated DEGs (log2FC>1 and adj.P<0.05) and STRING PPI network (center: Translation factor, node: DEGs, edges: weighted by -log2(adj.P)) |
 |
 * Edge colors based on TCGA cancer types. |
| * Overlap between DEGs (log2FC>1 and adj.P<0.05) and STRING PPI network per cancer (center: Translation factor, node: DEGs, node color: log2FC, edges: weighted by -log2(adj.P)) |
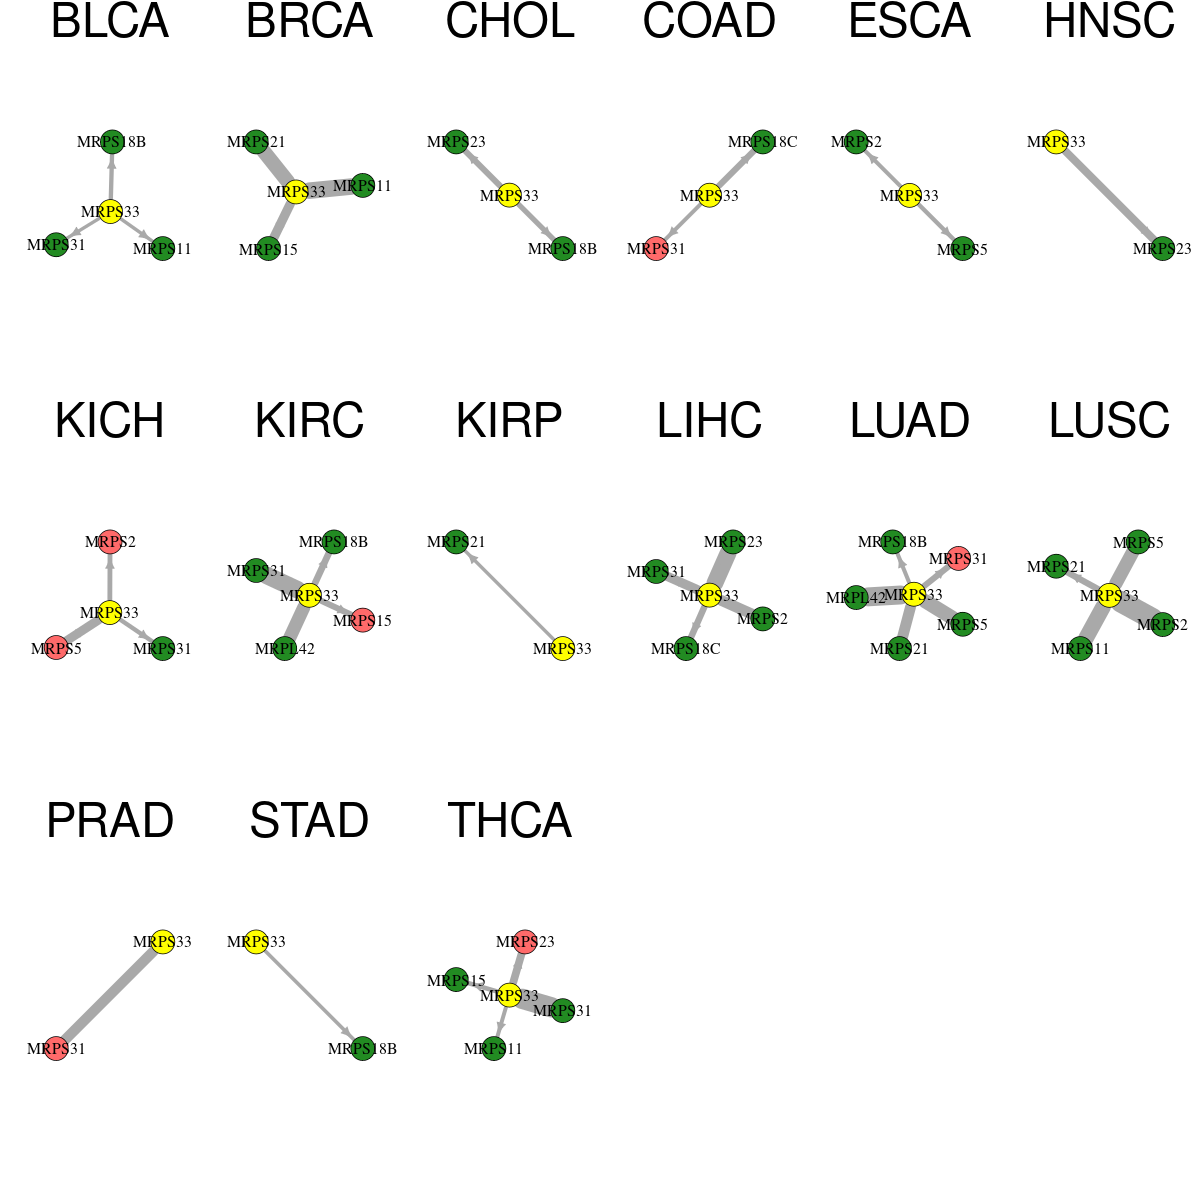 |
| Cancer type | Translation factor | Interacting protein coding gene | FC | adj.pval |
| LIHC | MRPS33 | MRPS31 | -1.07565232256163 | 0.000180054839259286 |
| BRCA | MRPS33 | MRPS15 | -2.19567551682318 | 0.000188684660674703 |
| KICH | MRPS33 | MRPS5 | 1.25108287838437 | 0.000249803066253662 |
| HNSC | MRPS33 | MRPS23 | -1.64850118241992 | 0.0007221434505027 |
| THCA | MRPS33 | MRPS23 | 1.86640051281615 | 0.000772056397653126 |
| KIRC | MRPS33 | MRPS18B | -1.08999348010674 | 0.00208385211535325 |
| LIHC | MRPS33 | MRPS18C | -1.25336042046698 | 0.00251545393492315 |
| LUSC | MRPS33 | MRPS21 | -1.06738210898451 | 0.00291962754379891 |
| COAD | MRPS33 | MRPS18C | -3.48505830240365 | 0.00322914123535157 |
| LUAD | MRPS33 | MRPS31 | 1.58140915700442 | 0.00351308111790755 |
| KIRC | MRPS33 | MRPS15 | 1.11572283836012 | 0.00361818577801855 |
| CHOL | MRPS33 | MRPS23 | -3.47507217165732 | 0.00390625 |
| CHOL | MRPS33 | MRPS18B | -1.34341961473083 | 0.0078125 |
| KICH | MRPS33 | MRPS2 | 1.26543989555015 | 0.0114533305168152 |
| THCA | MRPS33 | MRPS15 | -1.19960602422995 | 0.0140154883942907 |
| KICH | MRPS33 | MRPS31 | -1.44171613577495 | 0.0173123478889465 |
| BLCA | MRPS33 | MRPS18B | -2.79316203705083 | 0.0180816650390625 |
| ESCA | MRPS33 | MRPS5 | -2.15440118747854 | 0.0185546875 |
| LUAD | MRPS33 | MRPS18B | -2.59132604284176 | 0.0228310323601027 |
| ESCA | MRPS33 | MRPS2 | -3.20556788084675 | 0.0244140625 |
| THCA | MRPS33 | MRPS11 | -3.10694728540962 | 0.0252226935182201 |
| COAD | MRPS33 | MRPS31 | 1.25930610083678 | 0.0253507494926453 |
| STAD | MRPS33 | MRPS18B | -2.18783845061495 | 0.0341199110262096 |
| BLCA | MRPS33 | MRPS11 | -2.30276998968219 | 0.040130615234375 |
| KIRP | MRPS33 | MRPS21 | -1.88933102521932 | 0.0413399673998356 |
| BLCA | MRPS33 | MRPS31 | -1.74989716581638 | 0.0445594787597656 |
| BRCA | MRPS33 | MRPS21 | -1.81975786291087 | 1.52500483244108e-06 |
| LIHC | MRPS33 | MRPS23 | -3.60547266789887 | 1.76596269781643e-07 |
| LUAD | MRPS33 | MRPS5 | -2.20881945885927 | 1.77904381378076e-06 |
| LUSC | MRPS33 | MRPS2 | -2.70930846488508 | 1.92864354932136e-09 |
| BRCA | MRPS33 | MRPS11 | -1.24304977976804 | 2.31302509538916e-07 |
| LUAD | MRPS33 | MRPL42 | -6.34610249602491 | 2.48255276366547e-08 |
| LUAD | MRPS33 | MRPS21 | -2.12828541655424 | 4.20890892730867e-05 |
| LIHC | MRPS33 | MRPS2 | -1.14771055358828 | 4.2584580238307e-05 |
| LUSC | MRPS33 | MRPS5 | -7.65956389962319 | 4.27210217182982e-06 |
| KIRC | MRPS33 | MRPL42 | -4.382095336248 | 5.26630854166927e-06 |
| LUSC | MRPS33 | MRPS11 | -2.9004097541444 | 5.43966600483641e-07 |
| PRAD | MRPS33 | MRPS31 | 1.42878008978338 | 6.76861513404814e-05 |
| THCA | MRPS33 | MRPS31 | -1.55759809933211 | 6.91106419786075e-09 |
| KIRC | MRPS33 | MRPS31 | -4.32541004240865 | 9.31897250092369e-08 |
| Protein-protein interactors with this translation factor (BIOGRID-3.4.160) |
| PPI interactors with MRPS33 |
| NOL12, RPL13, TRA2A, RPL6, MRPS2, ZC3H3, RPS8, TRMT10B, ZNF707, MRPS31, MRPS5, HNRNPU, CDKN2AIP, CISD3, CDC14B, MRPS34, MRPS27, MRPS15, MRPS11, PDGFB, AURKAIP1, ZNF169, E4F1, RPL18, ZBTB48, RBM42, SNRNP70, EFTUD2, MEPCE, LARP7, RECQL4, MRM1, HSPD1, PDK1, TRMT61B, TCF7L2, CUL9, ZC3H18, FGFR1, PTPRR, SNCA, SRC, XPC, ACAD9, AUH, C12orf65, C17orf80, C1QBP, C21orf33, C6orf203, C8orf82, MCUR1, CCDC90B, CHCHD1, CRYZ, CS, DDX28, DHX30, FASTKD2, FASTKD3, FASTKD5, GFM1, GFM2, GRSF1, HINT2, ICT1, LONP1, LRPPRC, CCDC109B, MDH2, METTL15, METTL17, MRPL11, MRPS12, MRPS26, MRRF, MTERF3, MTFMT, MTG1, MTG2, MTIF2, MTIF3, MTRF1, MTRF1L, NGRN, PMPCA, PMPCB, RPUSD3, RPUSD4, SLIRP, SSBP1, TACO1, TBRG4, TEFM, TFAM, TMEM70, TRUB2, TSFM, TUFM, VWA8, EXD2, ORF4a, HSCB, MAP4K3, LIN28B, YBX1, RPL26, MRPS18B, RPL17, ABT1, RBMS2, MRPS17, GLI4, SRSF3, ZNF460, RPS9, H1FNT, MRPS18C, MRPS23, HNRNPR, SRSF6, MRPS6, MRPS25, MCAT, RBM47, GLTSCR2, MRPS7, RPL4, APOBEC3D, MRPL2, MRPL18, MED17, CBX6, RPL10, SRP14, MRPS24, RPL23A, HIST1H2AM, MRPS9, RPL35, ZNF574, SRSF7, NEIL1, RPL36AL, KLF12, |
Top |
|
| Clinically associated variants from ClinVar. |
| Gene | Chr | Position | RefSeq | VarSeq | RefSeeq | VarType | Pathogenic | Disease | VarInfo |
| nsSNVs with sample frequency (size of circle) from TCGA 33 cancers. |
 |
| SNVs and Indels |
| Gene | Cancer type | Chromosome | Start | End | RefSeeq | MutSeq | Mutation type | AAchange | # samples |
| MRPS33 | UCS | chr7 | 140710232 | 140710232 | G | T | Missense_Mutation | p.L68I | 3 |
| MRPS33 | ESCA | chr7 | 140710420 | 140710420 | G | A | Missense_Mutation | p.S5L | 3 |
| MRPS33 | PAAD | chr7 | 140710243 | 140710243 | G | A | Missense_Mutation | p.T64M | 3 |
| MRPS33 | SKCM | chr7 | 140710239 | 140710239 | G | A | Silent | p.L65L | 2 |
| MRPS33 | UCEC | chr7 | 140710251 | 140710251 | G | T | Silent | p.L61 | 2 |
| MRPS33 | LIHC | chr7 | 140710231 | 140710231 | A | G | Missense_Mutation | 2 | |
| MRPS33 | LIHC | chr7 | 140710338 | 140710338 | T | C | Silent | 2 | |
| MRPS33 | BRCA | chr7 | 140706249 | 140706249 | C | G | Missense_Mutation | p.R101T | 2 |
| MRPS33 | CESC | chr7 | 140710384 | 140710384 | C | T | Missense_Mutation | 2 | |
| MRPS33 | LIHC | chr7 | 140710338 | 140710338 | T | C | Silent | p.K32K | 2 |
| MRPS33 | STAD | chr7 | 140706259 | 140706259 | C | T | Missense_Mutation | p.E98K | 2 |
| MRPS33 | STAD | chr7 | 140706300 | 140706300 | C | T | Missense_Mutation | p.R84Q | 2 |
| MRPS33 | ESCA | chr7 | 140710420 | 140710420 | G | A | Missense_Mutation | 2 | |
| MRPS33 | PAAD | chr7 | 140710243 | 140710243 | G | A | Missense_Mutation | 2 | |
| MRPS33 | UCEC | chr7 | 140706286 | 140706286 | G | T | Missense_Mutation | p.R89S | 2 |
| MRPS33 | KIRC | chr7 | 140710230 | 140710230 | A | C | Silent | p.L68L | 1 |
| MRPS33 | SKCM | chr7 | 140710238 | 140710238 | G | A | Nonsense_Mutation | p.R66X | 1 |
| MRPS33 | UCS | chr7 | 140710232 | 140710232 | G | T | Missense_Mutation | 1 | |
| MRPS33 | SKCM | chr7 | 140706242 | 140706242 | T | C | Silent | p.A103A | 1 |
| MRPS33 | LIHC | chr7 | 140710383 | 140710383 | C | T | Silent | 1 | |
| MRPS33 | SKCM | chr7 | 140710238 | 140710238 | G | A | Nonsense_Mutation | p.R66* | 1 |
| MRPS33 | COAD | chr7 | 140710260 | 140710260 | G | A | Silent | p.Y58Y | 1 |
| MRPS33 | LIHC | chr7 | 140710231 | 140710231 | A | G | Missense_Mutation | p.L68P | 1 |
| MRPS33 | LIHC | chr7 | 140706238 | 140706238 | T | - | Frame_Shift_Del | p.R105fs | 1 |
| MRPS33 | THYM | chr7 | 140710358 | 140710358 | T | C | Missense_Mutation | 1 | |
| MRPS33 | LIHC | chr7 | 140710377 | 140710377 | A | - | Frame_Shift_Del | p.F19fs | 1 |
| MRPS33 | UCEC | chr7 | 140706271 | 140706271 | G | A | Missense_Mutation | p.P94S | 1 |
| MRPS33 | HNSC | chr7 | 140710224 | 140710224 | G | C | Silent | 1 | |
| MRPS33 | MESO | chr7 | 140710412 | 140710412 | C | A | Missense_Mutation | 1 | |
| MRPS33 | UCEC | chr7 | 140710370 | 140710370 | C | - | Frame_Shift_Del | p.V22fs | 1 |
| MRPS33 | HNSC | chr7 | 140710224 | 140710224 | G | C | Silent | p.L70L | 1 |
| MRPS33 | UCEC | chr7 | 140706250 | 140706250 | T | - | Frame_Shift_Del | p.R101fs | 1 |
| MRPS33 | KIRC | chr7 | 140710333 | 140710333 | A | - | Frame_Shift_Del | p.V34fs | 1 |
| Copy number variation (CNV) of MRPS33 * Click on the image to open the original image in a new window. |
 |
| Fusion gene breakpoints (product of the structural variants (SVs)) across MRPS33 * Click on the image to open the UCSC genome browser with custom track showing this image in a new window. |
 |
| Fusion genes with this translation factor from FusionGDB2.0. |
| FusionGDB2 ID | Disease | Sample | Hgene | Hchr | Hbp | Hstrand | Tgene | Tchr | Tbp | Tstrand |
| 54117 | BLCA | TCGA-K4-A3WV-01A | BRAF | chr7 | 140624366 | - | MRPS33 | chr7 | 140706335 | - |
| 54117 | BLCA | TCGA-K4-A3WV-01A | BRAF | chr7 | 140624366 | - | MRPS33 | chr7 | 140710460 | - |
| 54117 | N/A | BE835337 | CTNNB1 | chr3 | 41281235 | + | MRPS33 | chr7 | 140706183 | - |
| 54117 | PRAD | TCGA-YJ-A8SW-01A | LUC7L2 | chr7 | 139060902 | + | MRPS33 | chr7 | 140710460 | - |
| 54121 | OV | TCGA-36-1577 | MKRN1 | chr7 | 140178959 | - | MRPS33 | chr7 | 140706335 | - |
| 54121 | OV | TCGA-36-1577 | MKRN1 | chr7 | 140178959 | - | MRPS33 | chr7 | 140710460 | - |
| 54121 | OV | TCGA-36-1577-01A | MKRN1 | chr7 | 140178960 | - | MRPS33 | chr7 | 140706335 | - |
| 54121 | OV | TCGA-36-1577-01A | MKRN1 | chr7 | 140178960 | - | MRPS33 | chr7 | 140710417 | - |
| 54121 | OV | TCGA-36-1577-01A | MKRN1 | chr7 | 140178960 | - | MRPS33 | chr7 | 140710460 | - |
Top |
|
| Kaplan-Meier plots with logrank tests of overall survival (OS) |
 |
| Cancer type | Translation factor | Coefficent | Hazard ratio | Wald test pval | Likelihool ratio pval | Logrank test pval | # samples |
Top |
|
| Differential gene expression between female and male. (Wilcoxon test, pval<0.05) |
 |
| Cancer type | Translation factor | pval | adj.p |
| LIHC | MRPS33 | 0.000174985573174483 | 0.0047 |
| KIRP | MRPS33 | 0.000581059302109562 | 0.015 |
| KIRC | MRPS33 | 6.46745378341243e-06 | 0.00018 |
Top |
|
| Differential gene expression between young and old age groups (Wilcoxon test, pval<0.05) |
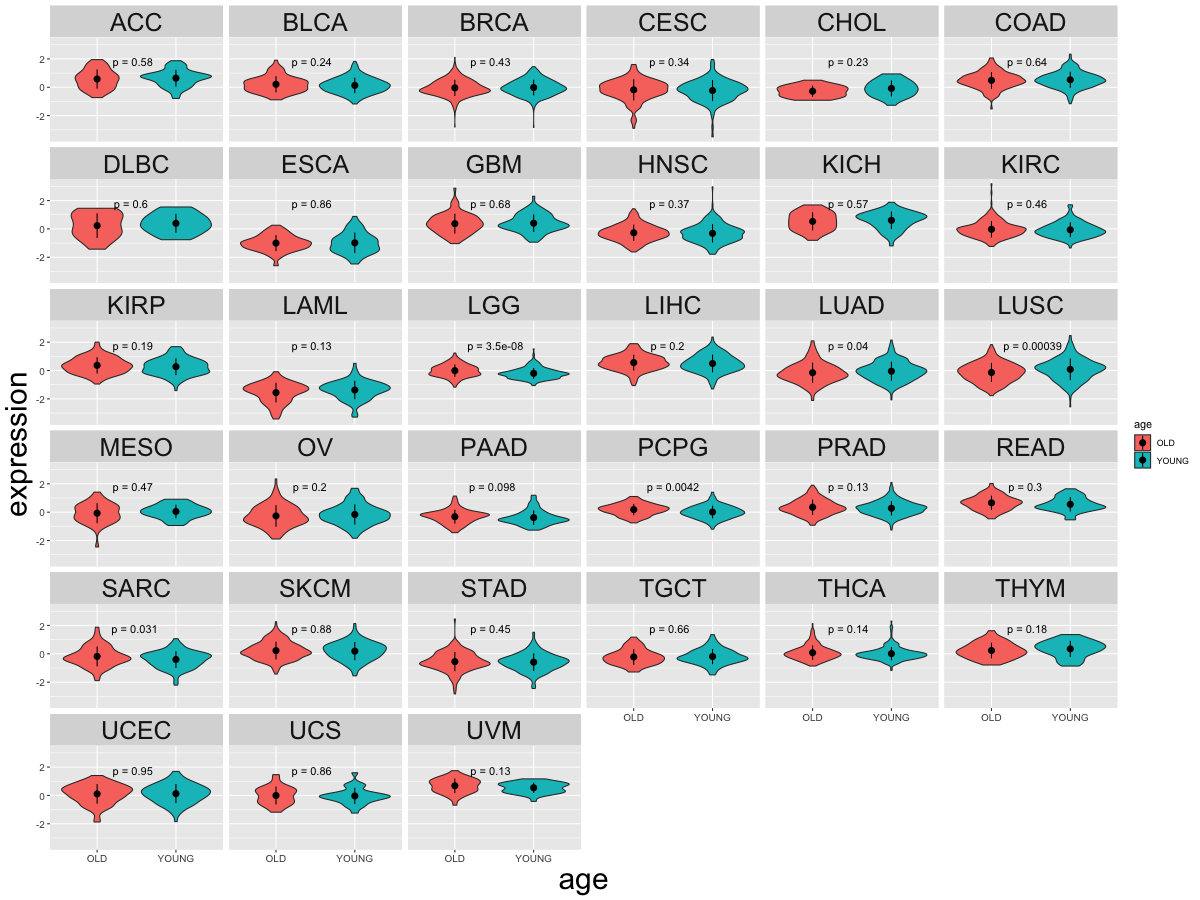 |
| Cancer type | Translation factor | pval | adj.p |
| LUAD | MRPS33 | 0.0403583495377016 | 1 |
| LUSC | MRPS33 | 0.000390845961874695 | 0.013 |
| LGG | MRPS33 | 3.5391101600289e-08 | 1.2e-06 |
| PCPG | MRPS33 | 0.00419012078887336 | 0.13 |
| SARC | MRPS33 | 0.031360322499754 | 0.94 |
Top |
|
| Drugs targeting genes involved in this translation factor. (DrugBank Version 5.1.8 2021-05-08) |
| UniProtAcc | DrugBank ID | Drug name | Drug activity | Drug type | Drug status |
Top |
|
| Diseases associated with this translation factor. (DisGeNet 4.0) |
| Disease ID | Disease Name | # PubMeds | Disease source |
| C0005586 | Bipolar Disorder | 1 | CTD_human |
| C0005587 | Depression, Bipolar | 1 | CTD_human |
| C0024713 | Manic Disorder | 1 | CTD_human |
| C0338831 | Manic | 1 | CTD_human |
(UTHealth)
Web File Viewing | Emergency Information |Campus Carry|Site Policies