
|
||||||
|

Translation Factor: TRNAU1AP (NCBI Gene ID:54952) |
|
 Gene Summary Gene Summary |
| Gene Information | Gene Name: TRNAU1AP | Gene ID: 54952 | Gene Symbol | TRNAU1AP | Gene ID | 54952 |
| Gene Name | tRNA selenocysteine 1 associated protein 1 | |
| Synonyms | PRO1902|SECP43|TRSPAP1 | |
| Cytomap | 1p35.3 | |
| Type of Gene | protein-coding | |
| Description | tRNA selenocysteine 1-associated protein 1tRNA selenocysteine associated protein (SECP43)tRNA selenocysteine-associated protein 1 | |
| Modification date | 20200313 | |
| UniProtAcc | Q9NX07 | |
| Child GO biological process term(s) under GO:0006412 |
| GO ID | GO term |
| GO:0006417 | Regulation of translation |
| GO:0006414 | Translational elongation |
| GO:0006412 | Translation |
| Gene ontology of translaction factor with evidence of Inferred from Direct Assay (IDA) from Entrez |
| Partner | Gene | GO ID | GO term | PubMed ID |
| Inferred gene age of translation factor. |
| Gene | Inferred gene age group among (0 - 67.6], (67.6 - 355.7], (355.7 - 733], (733 - 1119.25], >1119.25 |
| TRNAU1AP | >1119.25 |
Top |
|
| We searched PubMed using 'TRNAU1AP[title] AND translation [title] AND human.' |
| Gene | Title | PMID |
| TRNAU1AP | . | . |
Top |
|
| Skipped exons in TCGA and GTEx based on Ensembl gene isoform structure. * Click on the image to open the UCSC genome browser with custom track showing this image in a new window. For more annotations, please visit our ExonSkipDB. |
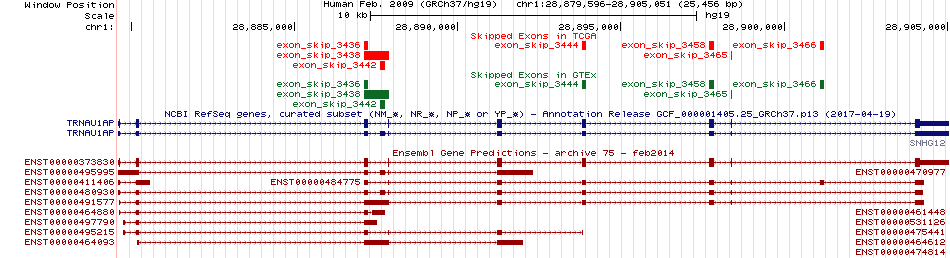 |
| Open reading frame (ORF) analsis of exon skipping events based on Ensembl gene isoform structure. * Click on the break point to see the gene structure around the break point region using the UCSC Genome Browser. |
| ENST | Exon skip start (DNA) | Exon Skip end (DNA) | ORF |
| ENST00000373830 | 28887144 | 28887244 | Frame-shift |
| ENST00000373830 | 28893805 | 28893925 | In-frame |
| ENST00000373830 | 28897687 | 28897850 | Frame-shift |
| ENST00000373830 | 28898378 | 28898412 | Frame-shift |
| Exon skipping position in the amino acid sequence. |
| ENST | Exon skip start (DNA) | Exon Skip end (DNA) | Len(transcript seq) | Exon skip start (mRNA) | Exon Skip end (mRNA) | Len(amino acid seq) | Exon skip start (AA) | Exon Skip end (AA) |
| ENST00000373830 | 28893805 | 28893925 | 1810 | 437 | 556 | 287 | 137 | 176 |
| Potentially (partially) lost protein functional features of UniProt. |
| UniProtAcc | Exon skip start (AA) | Exon Skip end (AA) | Function feature start (AA) | Function feature end (AA) | Functional feature type | Functional feature desc. |
| Q9NX07 | 137 | 176 | 1 | 287 | Chain | ID=PRO_0000304917;Note=tRNA selenocysteine 1-associated protein 1 |
| Q9NX07 | 137 | 176 | 96 | 175 | Domain | Note=RRM 2;Ontology_term=ECO:0000255;evidence=ECO:0000255|PROSITE-ProRule:PRU00176 |
| Q9NX07 | 137 | 176 | 136 | 145 | Beta strand | Ontology_term=ECO:0000244;evidence=ECO:0000244|PDB:2DHG |
| Q9NX07 | 137 | 176 | 147 | 156 | Helix | Ontology_term=ECO:0000244;evidence=ECO:0000244|PDB:2DHG |
| Q9NX07 | 137 | 176 | 157 | 159 | Turn | Ontology_term=ECO:0000244;evidence=ECO:0000244|PDB:2DHG |
| Q9NX07 | 137 | 176 | 162 | 166 | Beta strand | Ontology_term=ECO:0000244;evidence=ECO:0000244|PDB:2DHG |
Top |
|
| Gene expression level across TCGA pancancer |
 |
| Gene expression level across GTEx pantissue |
 |
| Expression level of gene isoforms across TCGA pancancer |
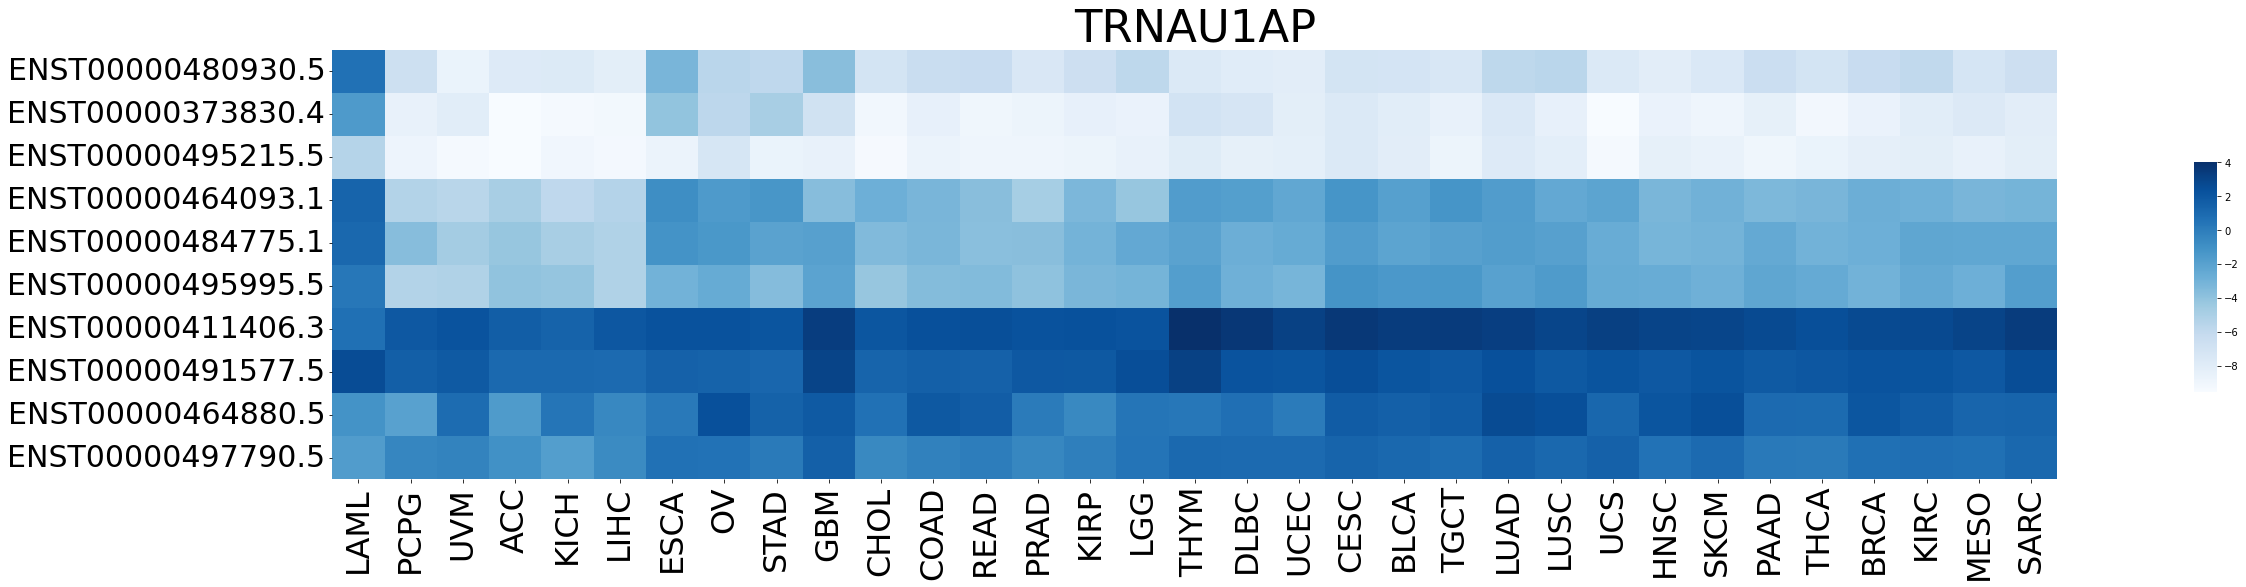 |
| Expression level of gene isoforms across GTEx pantissue |
 |
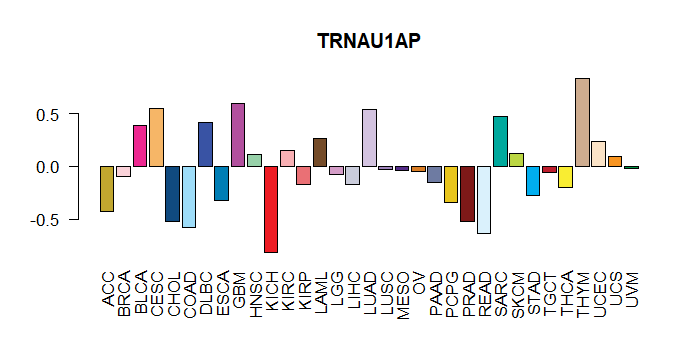
| Cancer(tissue) type-specific expression level of Translation factor using z-score distriution |
 |
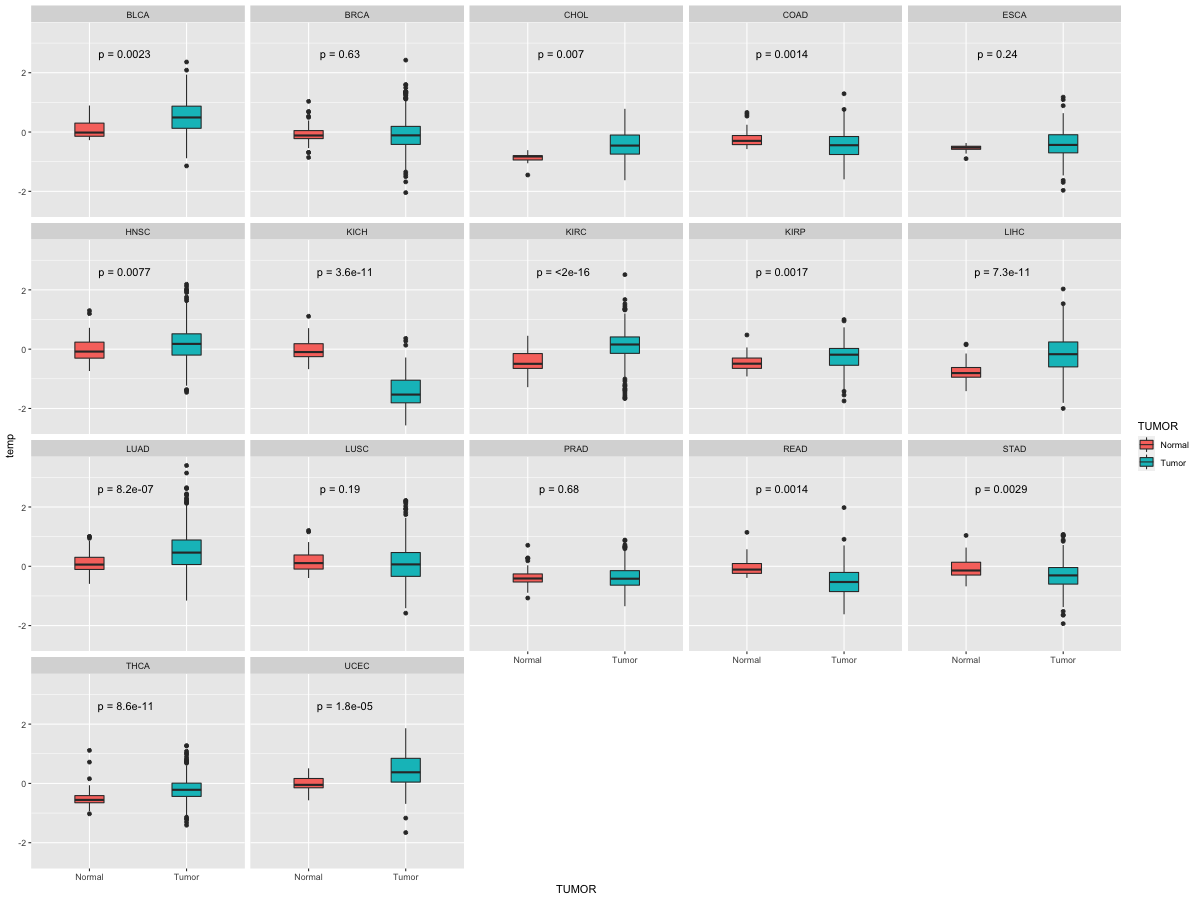
| Differential expression between tumor and matched normal (in the cancer types with more than 10 matched samples) |
 |
| Cancer type | Translation factor | FC | adj.pval |
| LIHC | TRNAU1AP | -1.56635696696237 | 0.000137265065605683 |
| CHOL | TRNAU1AP | -1.36228203168816 | 0.02734375 |
| THCA | TRNAU1AP | -2.34899508686103 | 1.55290879513537e-06 |
Top |
|
| Translation factor expression regulation through miRNA binding |
| Cancer type | Gene | miRNA | TargetScan binding score (Context++ score percentile) | Coefficient | Pvalue |
| Translation factor expression regulation through methylation in the promoter of Translation factor |
 |
| Cancer type | Gene | methyl group b | methyl group a | DEG pval | avg methyl in b | avg methyl in a | avg exp in b | avg exp in a |
| Translation factor expression regulation through methylation in the gene body of Translation factor (positive regulation) |
 |
| Cancer type | Gene | methyl group b | methyl group a | DEG pval | avg methyl in b | avg methyl in a | avg exp in b | avg exp in a |
| Translation factor expression regulation through copy number variation of Translation factor |
 |
| Cancer type | Gene | Coefficient | Pvalue |
| LIHC | TRNAU1AP | -0.081095205 | 0.029863767 |
Top |
|
| Strongly correlated genes belong to cellular important gene groups with TRNAU1AP (coefficient>0.8, pval<0.05, node color based on FC between tumor and matched normal). Significantly associated important genes in the individual cancer types. * Cell metabolism gene: cell metabolism genes from REACTOME (black edge), IUPHAR: drug target genes from IUPHAR (blue edge), Kinase: human kinase genes (brown edge), CGC: cancer gene census genes (orange edge), TSG: tumor suppresor genes (purple edge), Epifactor: epigenetic factors (light blue edge), TF: transcription factors (green) |
 |
| Cancer type | Gene group | Translation factor | Correlated gene | Coefficient | Pvalue |
| GBM | Cell metabolism gene | TRNAU1AP | SNRPG | 0.826860667 | 2.38E-44 |
| KICH | Cell metabolism gene | TRNAU1AP | TXNDC12 | 0.818840134 | 3.59E-23 |
| KICH | Cell metabolism gene | TRNAU1AP | LSM2 | 0.822606762 | 1.54E-23 |
| KICH | IUPHAR | TRNAU1AP | STK19 | 0.811938161 | 1.61E-22 |
| KICH | Kinase | TRNAU1AP | STK19 | 0.811938161 | 1.61E-22 |
| KICH | TF | TRNAU1AP | CREB3L4 | 0.817970903 | 4.35E-23 |
| KICH | TSG | TRNAU1AP | TTC4 | 0.855372113 | 3.70E-27 |
| LGG | Cell metabolism gene | TRNAU1AP | AK2 | 0.809053122 | 5.76E-124 |
| LGG | Cell metabolism gene | TRNAU1AP | PSMA5 | 0.809284732 | 4.32E-124 |
| LGG | TSG | TRNAU1AP | TTC4 | 0.83622005 | 7.22E-140 |
| TGCT | Epifactor | TRNAU1AP | INO80E | 0.8028673 | 2.03E-36 |
| THYM | Cell metabolism gene | TRNAU1AP | TOMM22 | 0.801350663 | 1.50E-28 |
| THYM | Cell metabolism gene | TRNAU1AP | ACTB | 0.808370416 | 2.17E-29 |
| THYM | Cell metabolism gene | TRNAU1AP | PAFAH1B3 | 0.810528122 | 1.18E-29 |
| THYM | Cell metabolism gene | TRNAU1AP | SNRPD3 | 0.811312358 | 9.43E-30 |
| THYM | Cell metabolism gene | TRNAU1AP | PSMB1 | 0.8136885 | 4.76E-30 |
| THYM | Cell metabolism gene | TRNAU1AP | PGP | 0.814186727 | 4.12E-30 |
| THYM | Cell metabolism gene | TRNAU1AP | SNRPB | 0.815800017 | 2.57E-30 |
| THYM | Cell metabolism gene | TRNAU1AP | PHKG2 | 0.816355069 | 2.18E-30 |
| THYM | Cell metabolism gene | TRNAU1AP | POLD2 | 0.816508993 | 2.08E-30 |
| THYM | Cell metabolism gene | TRNAU1AP | PSMD9 | 0.816911898 | 1.85E-30 |
| THYM | Cell metabolism gene | TRNAU1AP | NT5M | 0.817456067 | 1.57E-30 |
| THYM | Cell metabolism gene | TRNAU1AP | POLR2J | 0.818313906 | 1.22E-30 |
| THYM | Cell metabolism gene | TRNAU1AP | SLC27A5 | 0.818381879 | 1.20E-30 |
| THYM | Cell metabolism gene | TRNAU1AP | INPP5K | 0.819469304 | 8.63E-31 |
| THYM | Cell metabolism gene | TRNAU1AP | PSMA6 | 0.821237681 | 5.06E-31 |
| THYM | Cell metabolism gene | TRNAU1AP | POLR3K | 0.821491725 | 4.68E-31 |
| THYM | Cell metabolism gene | TRNAU1AP | TIMM22 | 0.822478858 | 3.46E-31 |
| THYM | Cell metabolism gene | TRNAU1AP | MTMR14 | 0.827164151 | 8.07E-32 |
| THYM | Cell metabolism gene | TRNAU1AP | DGUOK | 0.828049916 | 6.10E-32 |
| THYM | Cell metabolism gene | TRNAU1AP | TIMM13 | 0.830430482 | 2.85E-32 |
| THYM | Cell metabolism gene | TRNAU1AP | LSM3 | 0.833166903 | 1.17E-32 |
| THYM | Cell metabolism gene | TRNAU1AP | SLC25A11 | 0.833598426 | 1.02E-32 |
| THYM | Cell metabolism gene | TRNAU1AP | TIMM8B | 0.833870238 | 9.28E-33 |
| THYM | Cell metabolism gene | TRNAU1AP | APRT | 0.835679414 | 5.10E-33 |
| THYM | Cell metabolism gene | TRNAU1AP | SNRPD1 | 0.837059734 | 3.21E-33 |
| THYM | Cell metabolism gene | TRNAU1AP | PSMB10 | 0.837130522 | 3.13E-33 |
| THYM | Cell metabolism gene | TRNAU1AP | SNRPF | 0.838902222 | 1.72E-33 |
| THYM | Cell metabolism gene | TRNAU1AP | PSMB3 | 0.839015194 | 1.65E-33 |
| THYM | Cell metabolism gene | TRNAU1AP | POLA2 | 0.840526503 | 9.85E-34 |
| THYM | Cell metabolism gene | TRNAU1AP | ACOT8 | 0.841397506 | 7.29E-34 |
| THYM | Cell metabolism gene | TRNAU1AP | DTYMK | 0.841698068 | 6.56E-34 |
| THYM | Cell metabolism gene | TRNAU1AP | FAU | 0.841710808 | 6.53E-34 |
| THYM | Cell metabolism gene | TRNAU1AP | GUK1 | 0.843831754 | 3.11E-34 |
| THYM | Cell metabolism gene | TRNAU1AP | MED18 | 0.845057034 | 2.01E-34 |
| THYM | Cell metabolism gene | TRNAU1AP | ZNRD1 | 0.846520381 | 1.19E-34 |
| THYM | Cell metabolism gene | TRNAU1AP | PSMB6 | 0.847292182 | 9.03E-35 |
| THYM | Cell metabolism gene | TRNAU1AP | LSM5 | 0.848008351 | 6.97E-35 |
| THYM | Cell metabolism gene | TRNAU1AP | PSMA5 | 0.848596991 | 5.62E-35 |
| THYM | Cell metabolism gene | TRNAU1AP | APOA1 | 0.852669352 | 1.24E-35 |
| THYM | Cell metabolism gene | TRNAU1AP | UROD | 0.854351623 | 6.58E-36 |
| THYM | Cell metabolism gene | TRNAU1AP | PSMA4 | 0.855115426 | 4.92E-36 |
| THYM | Cell metabolism gene | TRNAU1AP | AAAS | 0.858120686 | 1.54E-36 |
| THYM | Cell metabolism gene | TRNAU1AP | GALK1 | 0.858778267 | 1.19E-36 |
| THYM | Cell metabolism gene | TRNAU1AP | SNRPD2 | 0.859386106 | 9.33E-37 |
| THYM | Cell metabolism gene | TRNAU1AP | LSM4 | 0.86227196 | 2.94E-37 |
| THYM | Cell metabolism gene | TRNAU1AP | LSM2 | 0.868634207 | 2.10E-38 |
| THYM | Cell metabolism gene | TRNAU1AP | SEC61B | 0.869441579 | 1.49E-38 |
| THYM | Cell metabolism gene | TRNAU1AP | FPGS | 0.869762659 | 1.29E-38 |
| THYM | Cell metabolism gene | TRNAU1AP | PSMB7 | 0.87223317 | 4.43E-39 |
| THYM | Cell metabolism gene | TRNAU1AP | PSMD13 | 0.899299442 | 6.37E-45 |
| THYM | Cell metabolism gene | TRNAU1AP | PSMC3 | 0.905431183 | 1.77E-46 |
| THYM | CGC | TRNAU1AP | U2AF1 | 0.812821155 | 6.11E-30 |
| THYM | CGC | TRNAU1AP | BAX | 0.827651681 | 6.92E-32 |
| THYM | CGC | TRNAU1AP | RBM10 | 0.834586174 | 7.33E-33 |
| THYM | CGC | TRNAU1AP | SDHAF2 | 0.862110049 | 3.14E-37 |
| THYM | CGC | TRNAU1AP | TFPT | 0.881943935 | 5.21E-41 |
| THYM | Epifactor | TRNAU1AP | SUV420H2 | 0.801036318 | 1.64E-28 |
| THYM | Epifactor | TRNAU1AP | HIST1H2AJ | 0.803338007 | 8.76E-29 |
| THYM | Epifactor | TRNAU1AP | MBD3 | 0.803782752 | 7.76E-29 |
| THYM | Epifactor | TRNAU1AP | SIRT6 | 0.805610355 | 4.69E-29 |
| THYM | Epifactor | TRNAU1AP | ACTB | 0.808370416 | 2.17E-29 |
| THYM | Epifactor | TRNAU1AP | SUV39H1 | 0.812840755 | 6.08E-30 |
| THYM | Epifactor | TRNAU1AP | ANP32B | 0.816362663 | 2.18E-30 |
| THYM | Epifactor | TRNAU1AP | INO80E | 0.824860575 | 1.66E-31 |
| THYM | Epifactor | TRNAU1AP | CDK9 | 0.825811053 | 1.23E-31 |
| THYM | Epifactor | TRNAU1AP | PRPF31 | 0.827963681 | 6.27E-32 |
| THYM | Epifactor | TRNAU1AP | DMAP1 | 0.831474725 | 2.03E-32 |
| THYM | Epifactor | TRNAU1AP | CCDC101 | 0.831506693 | 2.01E-32 |
| THYM | Epifactor | TRNAU1AP | ZNHIT1 | 0.834248882 | 8.19E-33 |
| THYM | Epifactor | TRNAU1AP | HMGN2 | 0.83524349 | 5.89E-33 |
| THYM | Epifactor | TRNAU1AP | H2AFX | 0.83661547 | 3.73E-33 |
| THYM | Epifactor | TRNAU1AP | PPM1G | 0.838090012 | 2.27E-33 |
| THYM | Epifactor | TRNAU1AP | MAZ | 0.839317888 | 1.49E-33 |
| THYM | Epifactor | TRNAU1AP | HIST2H2AC | 0.840391082 | 1.03E-33 |
| THYM | Epifactor | TRNAU1AP | RBX1 | 0.845375334 | 1.80E-34 |
| THYM | Epifactor | TRNAU1AP | HIRIP3 | 0.848469152 | 5.89E-35 |
| THYM | Epifactor | TRNAU1AP | BRMS1 | 0.84865144 | 5.51E-35 |
| THYM | Epifactor | TRNAU1AP | CXXC1 | 0.851017327 | 2.31E-35 |
| THYM | Epifactor | TRNAU1AP | SS18L2 | 0.857977431 | 1.62E-36 |
| THYM | Epifactor | TRNAU1AP | PRMT7 | 0.860019878 | 7.26E-37 |
| THYM | Epifactor | TRNAU1AP | MCRS1 | 0.862939762 | 2.24E-37 |
| THYM | Epifactor | TRNAU1AP | C17orf49 | 0.866082822 | 6.15E-38 |
| THYM | Epifactor | TRNAU1AP | TAF10 | 0.867889597 | 2.88E-38 |
| THYM | Epifactor | TRNAU1AP | RUVBL2 | 0.871862266 | 5.21E-39 |
| THYM | Epifactor | TRNAU1AP | PPP4C | 0.87733164 | 4.50E-40 |
| THYM | Epifactor | TRNAU1AP | TFPT | 0.881943935 | 5.21E-41 |
| THYM | Epifactor | TRNAU1AP | TRIM28 | 0.881978747 | 5.12E-41 |
| THYM | IUPHAR | TRNAU1AP | CTRL | 0.803429146 | 8.54E-29 |
| THYM | IUPHAR | TRNAU1AP | SIRT6 | 0.805610355 | 4.69E-29 |
| THYM | IUPHAR | TRNAU1AP | SPNS3 | 0.809376085 | 1.64E-29 |
| THYM | IUPHAR | TRNAU1AP | SUV39H1 | 0.812840755 | 6.08E-30 |
| THYM | IUPHAR | TRNAU1AP | PSMB1 | 0.8136885 | 4.76E-30 |
| THYM | IUPHAR | TRNAU1AP | S1PR4 | 0.81468125 | 3.56E-30 |
| THYM | IUPHAR | TRNAU1AP | PHKG2 | 0.816355069 | 2.18E-30 |
| THYM | IUPHAR | TRNAU1AP | NT5M | 0.817456067 | 1.57E-30 |
| THYM | IUPHAR | TRNAU1AP | SLC27A5 | 0.818381879 | 1.20E-30 |
| THYM | IUPHAR | TRNAU1AP | INPP5K | 0.819469304 | 8.63E-31 |
| THYM | IUPHAR | TRNAU1AP | CDK9 | 0.825811053 | 1.23E-31 |
| THYM | IUPHAR | TRNAU1AP | SLC25A11 | 0.833598426 | 1.02E-32 |
| THYM | IUPHAR | TRNAU1AP | PSMB6 | 0.847292182 | 9.03E-35 |
| THYM | IUPHAR | TRNAU1AP | PPIA | 0.848998666 | 4.86E-35 |
| THYM | IUPHAR | TRNAU1AP | CSNK2B | 0.851999843 | 1.60E-35 |
| THYM | IUPHAR | TRNAU1AP | PRMT7 | 0.860019878 | 7.26E-37 |
| THYM | IUPHAR | TRNAU1AP | TWF2 | 0.865763397 | 7.02E-38 |
| THYM | IUPHAR | TRNAU1AP | TRIM28 | 0.881978747 | 5.12E-41 |
| THYM | Kinase | TRNAU1AP | PHKG2 | 0.816355069 | 2.18E-30 |
| THYM | Kinase | TRNAU1AP | CDK9 | 0.825811053 | 1.23E-31 |
| THYM | Kinase | TRNAU1AP | TRIM28 | 0.881978747 | 5.12E-41 |
| THYM | TF | TRNAU1AP | MBD3 | 0.803782752 | 7.76E-29 |
| THYM | TF | TRNAU1AP | TIGD3 | 0.803992725 | 7.32E-29 |
| THYM | TF | TRNAU1AP | RBCK1 | 0.808534373 | 2.07E-29 |
| THYM | TF | TRNAU1AP | THAP3 | 0.809858141 | 1.43E-29 |
| THYM | TF | TRNAU1AP | NAIF1 | 0.815878999 | 2.51E-30 |
| THYM | TF | TRNAU1AP | ZNF668 | 0.816208143 | 2.28E-30 |
| THYM | TF | TRNAU1AP | ZNF688 | 0.816941454 | 1.83E-30 |
| THYM | TF | TRNAU1AP | ZNF691 | 0.817112889 | 1.74E-30 |
| THYM | TF | TRNAU1AP | ZBTB17 | 0.822450587 | 3.49E-31 |
| THYM | TF | TRNAU1AP | MXD3 | 0.838562313 | 1.93E-33 |
| THYM | TF | TRNAU1AP | ZNF428 | 0.839206167 | 1.55E-33 |
| THYM | TF | TRNAU1AP | MAZ | 0.839317888 | 1.49E-33 |
| THYM | TF | TRNAU1AP | DRAP1 | 0.844312332 | 2.62E-34 |
| THYM | TF | TRNAU1AP | CXXC1 | 0.851017327 | 2.31E-35 |
| THYM | TF | TRNAU1AP | ZNF653 | 0.858693536 | 1.23E-36 |
| THYM | TF | TRNAU1AP | GTF3A | 0.865446722 | 8.01E-38 |
| THYM | TF | TRNAU1AP | PIN1 | 0.870596442 | 9.04E-39 |
| THYM | TF | TRNAU1AP | ZNF444 | 0.884046033 | 1.89E-41 |
| THYM | TF | TRNAU1AP | THYN1 | 0.922370228 | 2.13E-51 |
| THYM | TSG | TRNAU1AP | SIRT6 | 0.805610355 | 4.69E-29 |
| THYM | TSG | TRNAU1AP | NPRL2 | 0.811705062 | 8.43E-30 |
| THYM | TSG | TRNAU1AP | FBXO25 | 0.813641605 | 4.82E-30 |
| THYM | TSG | TRNAU1AP | ZNF668 | 0.816208143 | 2.28E-30 |
| THYM | TSG | TRNAU1AP | PARK7 | 0.821294565 | 4.97E-31 |
| THYM | TSG | TRNAU1AP | GLTSCR2 | 0.824913914 | 1.63E-31 |
| THYM | TSG | TRNAU1AP | PLEKHO1 | 0.82729121 | 7.75E-32 |
| THYM | TSG | TRNAU1AP | BAX | 0.827651681 | 6.92E-32 |
| THYM | TSG | TRNAU1AP | TSSC4 | 0.831672372 | 1.91E-32 |
| THYM | TSG | TRNAU1AP | H2AFX | 0.83661547 | 3.73E-33 |
| THYM | TSG | TRNAU1AP | GNB2L1 | 0.844862606 | 2.16E-34 |
| THYM | TSG | TRNAU1AP | AIF1 | 0.847166814 | 9.45E-35 |
| THYM | TSG | TRNAU1AP | BRMS1 | 0.84865144 | 5.51E-35 |
| THYM | TSG | TRNAU1AP | PIN1 | 0.870596442 | 9.04E-39 |
| THYM | TSG | TRNAU1AP | HTRA2 | 0.87692886 | 5.42E-40 |
| THYM | TSG | TRNAU1AP | AIP | 0.895974391 | 4.04E-44 |
| THYM | TSG | TRNAU1AP | PFN1 | 0.910820649 | 6.17E-48 |
| UCS | Cell metabolism gene | TRNAU1AP | TOMM22 | 0.801350663 | 1.50E-28 |
| UCS | Cell metabolism gene | TRNAU1AP | ACTB | 0.808370416 | 2.17E-29 |
| UCS | Cell metabolism gene | TRNAU1AP | PAFAH1B3 | 0.810528122 | 1.18E-29 |
| UCS | Cell metabolism gene | TRNAU1AP | SNRPD3 | 0.811312358 | 9.43E-30 |
| UCS | Cell metabolism gene | TRNAU1AP | PSMB1 | 0.8136885 | 4.76E-30 |
| UCS | Cell metabolism gene | TRNAU1AP | PGP | 0.814186727 | 4.12E-30 |
| UCS | Cell metabolism gene | TRNAU1AP | SNRPB | 0.815800017 | 2.57E-30 |
| UCS | Cell metabolism gene | TRNAU1AP | PHKG2 | 0.816355069 | 2.18E-30 |
| UCS | Cell metabolism gene | TRNAU1AP | POLD2 | 0.816508993 | 2.08E-30 |
| UCS | Cell metabolism gene | TRNAU1AP | PSMD9 | 0.816911898 | 1.85E-30 |
| UCS | Cell metabolism gene | TRNAU1AP | NT5M | 0.817456067 | 1.57E-30 |
| UCS | Cell metabolism gene | TRNAU1AP | POLR2J | 0.818313906 | 1.22E-30 |
| UCS | Cell metabolism gene | TRNAU1AP | SLC27A5 | 0.818381879 | 1.20E-30 |
| UCS | Cell metabolism gene | TRNAU1AP | INPP5K | 0.819469304 | 8.63E-31 |
| UCS | Cell metabolism gene | TRNAU1AP | PSMA6 | 0.821237681 | 5.06E-31 |
| UCS | Cell metabolism gene | TRNAU1AP | POLR3K | 0.821491725 | 4.68E-31 |
| UCS | Cell metabolism gene | TRNAU1AP | TIMM22 | 0.822478858 | 3.46E-31 |
| UCS | Cell metabolism gene | TRNAU1AP | MTMR14 | 0.827164151 | 8.07E-32 |
| UCS | Cell metabolism gene | TRNAU1AP | DGUOK | 0.828049916 | 6.10E-32 |
| UCS | Cell metabolism gene | TRNAU1AP | TIMM13 | 0.830430482 | 2.85E-32 |
| UCS | Cell metabolism gene | TRNAU1AP | LSM3 | 0.833166903 | 1.17E-32 |
| UCS | Cell metabolism gene | TRNAU1AP | SLC25A11 | 0.833598426 | 1.02E-32 |
| UCS | Cell metabolism gene | TRNAU1AP | TIMM8B | 0.833870238 | 9.28E-33 |
| UCS | Cell metabolism gene | TRNAU1AP | APRT | 0.835679414 | 5.10E-33 |
| UCS | Cell metabolism gene | TRNAU1AP | SNRPD1 | 0.837059734 | 3.21E-33 |
| UCS | Cell metabolism gene | TRNAU1AP | PSMB10 | 0.837130522 | 3.13E-33 |
| UCS | Cell metabolism gene | TRNAU1AP | SNRPF | 0.838902222 | 1.72E-33 |
| UCS | Cell metabolism gene | TRNAU1AP | PSMB3 | 0.839015194 | 1.65E-33 |
| UCS | Cell metabolism gene | TRNAU1AP | POLA2 | 0.840526503 | 9.85E-34 |
| UCS | Cell metabolism gene | TRNAU1AP | ACOT8 | 0.841397506 | 7.29E-34 |
| UCS | Cell metabolism gene | TRNAU1AP | DTYMK | 0.841698068 | 6.56E-34 |
| UCS | Cell metabolism gene | TRNAU1AP | FAU | 0.841710808 | 6.53E-34 |
| UCS | Cell metabolism gene | TRNAU1AP | GUK1 | 0.843831754 | 3.11E-34 |
| UCS | Cell metabolism gene | TRNAU1AP | MED18 | 0.845057034 | 2.01E-34 |
| UCS | Cell metabolism gene | TRNAU1AP | ZNRD1 | 0.846520381 | 1.19E-34 |
| UCS | Cell metabolism gene | TRNAU1AP | PSMB6 | 0.847292182 | 9.03E-35 |
| UCS | Cell metabolism gene | TRNAU1AP | LSM5 | 0.848008351 | 6.97E-35 |
| UCS | Cell metabolism gene | TRNAU1AP | PSMA5 | 0.848596991 | 5.62E-35 |
| UCS | Cell metabolism gene | TRNAU1AP | APOA1 | 0.852669352 | 1.24E-35 |
| UCS | Cell metabolism gene | TRNAU1AP | UROD | 0.854351623 | 6.58E-36 |
| UCS | Cell metabolism gene | TRNAU1AP | PSMA4 | 0.855115426 | 4.92E-36 |
| UCS | Cell metabolism gene | TRNAU1AP | AAAS | 0.858120686 | 1.54E-36 |
| UCS | Cell metabolism gene | TRNAU1AP | GALK1 | 0.858778267 | 1.19E-36 |
| UCS | Cell metabolism gene | TRNAU1AP | SNRPD2 | 0.859386106 | 9.33E-37 |
| UCS | Cell metabolism gene | TRNAU1AP | LSM4 | 0.86227196 | 2.94E-37 |
| UCS | Cell metabolism gene | TRNAU1AP | LSM2 | 0.868634207 | 2.10E-38 |
| UCS | Cell metabolism gene | TRNAU1AP | SEC61B | 0.869441579 | 1.49E-38 |
| UCS | Cell metabolism gene | TRNAU1AP | FPGS | 0.869762659 | 1.29E-38 |
| UCS | Cell metabolism gene | TRNAU1AP | PSMB7 | 0.87223317 | 4.43E-39 |
| UCS | Cell metabolism gene | TRNAU1AP | PSMD13 | 0.899299442 | 6.37E-45 |
| UCS | Cell metabolism gene | TRNAU1AP | PSMC3 | 0.905431183 | 1.77E-46 |
| UCS | CGC | TRNAU1AP | U2AF1 | 0.812821155 | 6.11E-30 |
| UCS | CGC | TRNAU1AP | BAX | 0.827651681 | 6.92E-32 |
| UCS | CGC | TRNAU1AP | RBM10 | 0.834586174 | 7.33E-33 |
| UCS | CGC | TRNAU1AP | SDHAF2 | 0.862110049 | 3.14E-37 |
| UCS | CGC | TRNAU1AP | TFPT | 0.881943935 | 5.21E-41 |
| UCS | Epifactor | TRNAU1AP | SUV420H2 | 0.801036318 | 1.64E-28 |
| UCS | Epifactor | TRNAU1AP | HIST1H2AJ | 0.803338007 | 8.76E-29 |
| UCS | Epifactor | TRNAU1AP | MBD3 | 0.803782752 | 7.76E-29 |
| UCS | Epifactor | TRNAU1AP | SIRT6 | 0.805610355 | 4.69E-29 |
| UCS | Epifactor | TRNAU1AP | ACTB | 0.808370416 | 2.17E-29 |
| UCS | Epifactor | TRNAU1AP | SUV39H1 | 0.812840755 | 6.08E-30 |
| UCS | Epifactor | TRNAU1AP | ANP32B | 0.816362663 | 2.18E-30 |
| UCS | Epifactor | TRNAU1AP | INO80E | 0.824860575 | 1.66E-31 |
| UCS | Epifactor | TRNAU1AP | CDK9 | 0.825811053 | 1.23E-31 |
| UCS | Epifactor | TRNAU1AP | PRPF31 | 0.827963681 | 6.27E-32 |
| UCS | Epifactor | TRNAU1AP | DMAP1 | 0.831474725 | 2.03E-32 |
| UCS | Epifactor | TRNAU1AP | CCDC101 | 0.831506693 | 2.01E-32 |
| UCS | Epifactor | TRNAU1AP | ZNHIT1 | 0.834248882 | 8.19E-33 |
| UCS | Epifactor | TRNAU1AP | HMGN2 | 0.83524349 | 5.89E-33 |
| UCS | Epifactor | TRNAU1AP | H2AFX | 0.83661547 | 3.73E-33 |
| UCS | Epifactor | TRNAU1AP | PPM1G | 0.838090012 | 2.27E-33 |
| UCS | Epifactor | TRNAU1AP | MAZ | 0.839317888 | 1.49E-33 |
| UCS | Epifactor | TRNAU1AP | HIST2H2AC | 0.840391082 | 1.03E-33 |
| UCS | Epifactor | TRNAU1AP | RBX1 | 0.845375334 | 1.80E-34 |
| UCS | Epifactor | TRNAU1AP | HIRIP3 | 0.848469152 | 5.89E-35 |
| UCS | Epifactor | TRNAU1AP | BRMS1 | 0.84865144 | 5.51E-35 |
| UCS | Epifactor | TRNAU1AP | CXXC1 | 0.851017327 | 2.31E-35 |
| UCS | Epifactor | TRNAU1AP | SS18L2 | 0.857977431 | 1.62E-36 |
| UCS | Epifactor | TRNAU1AP | PRMT7 | 0.860019878 | 7.26E-37 |
| UCS | Epifactor | TRNAU1AP | MCRS1 | 0.862939762 | 2.24E-37 |
| UCS | Epifactor | TRNAU1AP | C17orf49 | 0.866082822 | 6.15E-38 |
| UCS | Epifactor | TRNAU1AP | TAF10 | 0.867889597 | 2.88E-38 |
| UCS | Epifactor | TRNAU1AP | RUVBL2 | 0.871862266 | 5.21E-39 |
| UCS | Epifactor | TRNAU1AP | PPP4C | 0.87733164 | 4.50E-40 |
| UCS | Epifactor | TRNAU1AP | TFPT | 0.881943935 | 5.21E-41 |
| UCS | Epifactor | TRNAU1AP | TRIM28 | 0.881978747 | 5.12E-41 |
| UCS | IUPHAR | TRNAU1AP | CTRL | 0.803429146 | 8.54E-29 |
| UCS | IUPHAR | TRNAU1AP | SIRT6 | 0.805610355 | 4.69E-29 |
| UCS | IUPHAR | TRNAU1AP | SPNS3 | 0.809376085 | 1.64E-29 |
| UCS | IUPHAR | TRNAU1AP | SUV39H1 | 0.812840755 | 6.08E-30 |
| UCS | IUPHAR | TRNAU1AP | PSMB1 | 0.8136885 | 4.76E-30 |
| UCS | IUPHAR | TRNAU1AP | S1PR4 | 0.81468125 | 3.56E-30 |
| UCS | IUPHAR | TRNAU1AP | PHKG2 | 0.816355069 | 2.18E-30 |
| UCS | IUPHAR | TRNAU1AP | NT5M | 0.817456067 | 1.57E-30 |
| UCS | IUPHAR | TRNAU1AP | SLC27A5 | 0.818381879 | 1.20E-30 |
| UCS | IUPHAR | TRNAU1AP | INPP5K | 0.819469304 | 8.63E-31 |
| UCS | IUPHAR | TRNAU1AP | CDK9 | 0.825811053 | 1.23E-31 |
| UCS | IUPHAR | TRNAU1AP | SLC25A11 | 0.833598426 | 1.02E-32 |
| UCS | IUPHAR | TRNAU1AP | PSMB6 | 0.847292182 | 9.03E-35 |
| UCS | IUPHAR | TRNAU1AP | PPIA | 0.848998666 | 4.86E-35 |
| UCS | IUPHAR | TRNAU1AP | CSNK2B | 0.851999843 | 1.60E-35 |
| UCS | IUPHAR | TRNAU1AP | PRMT7 | 0.860019878 | 7.26E-37 |
| UCS | IUPHAR | TRNAU1AP | TWF2 | 0.865763397 | 7.02E-38 |
| UCS | IUPHAR | TRNAU1AP | TRIM28 | 0.881978747 | 5.12E-41 |
| UCS | Kinase | TRNAU1AP | PHKG2 | 0.816355069 | 2.18E-30 |
| UCS | Kinase | TRNAU1AP | CDK9 | 0.825811053 | 1.23E-31 |
| UCS | Kinase | TRNAU1AP | TRIM28 | 0.881978747 | 5.12E-41 |
| UCS | TF | TRNAU1AP | MBD3 | 0.803782752 | 7.76E-29 |
| UCS | TF | TRNAU1AP | TIGD3 | 0.803992725 | 7.32E-29 |
| UCS | TF | TRNAU1AP | RBCK1 | 0.808534373 | 2.07E-29 |
| UCS | TF | TRNAU1AP | THAP3 | 0.809858141 | 1.43E-29 |
| UCS | TF | TRNAU1AP | NAIF1 | 0.815878999 | 2.51E-30 |
| UCS | TF | TRNAU1AP | ZNF668 | 0.816208143 | 2.28E-30 |
| UCS | TF | TRNAU1AP | ZNF688 | 0.816941454 | 1.83E-30 |
| UCS | TF | TRNAU1AP | ZNF691 | 0.817112889 | 1.74E-30 |
| UCS | TF | TRNAU1AP | ZBTB17 | 0.822450587 | 3.49E-31 |
| UCS | TF | TRNAU1AP | MXD3 | 0.838562313 | 1.93E-33 |
| UCS | TF | TRNAU1AP | ZNF428 | 0.839206167 | 1.55E-33 |
| UCS | TF | TRNAU1AP | MAZ | 0.839317888 | 1.49E-33 |
| UCS | TF | TRNAU1AP | DRAP1 | 0.844312332 | 2.62E-34 |
| UCS | TF | TRNAU1AP | CXXC1 | 0.851017327 | 2.31E-35 |
| UCS | TF | TRNAU1AP | ZNF653 | 0.858693536 | 1.23E-36 |
| UCS | TF | TRNAU1AP | GTF3A | 0.865446722 | 8.01E-38 |
| UCS | TF | TRNAU1AP | PIN1 | 0.870596442 | 9.04E-39 |
| UCS | TF | TRNAU1AP | ZNF444 | 0.884046033 | 1.89E-41 |
| UCS | TF | TRNAU1AP | THYN1 | 0.922370228 | 2.13E-51 |
| UCS | TSG | TRNAU1AP | SIRT6 | 0.805610355 | 4.69E-29 |
| UCS | TSG | TRNAU1AP | NPRL2 | 0.811705062 | 8.43E-30 |
| UCS | TSG | TRNAU1AP | FBXO25 | 0.813641605 | 4.82E-30 |
| UCS | TSG | TRNAU1AP | ZNF668 | 0.816208143 | 2.28E-30 |
| UCS | TSG | TRNAU1AP | PARK7 | 0.821294565 | 4.97E-31 |
| UCS | TSG | TRNAU1AP | GLTSCR2 | 0.824913914 | 1.63E-31 |
| UCS | TSG | TRNAU1AP | PLEKHO1 | 0.82729121 | 7.75E-32 |
| UCS | TSG | TRNAU1AP | BAX | 0.827651681 | 6.92E-32 |
| UCS | TSG | TRNAU1AP | TSSC4 | 0.831672372 | 1.91E-32 |
| UCS | TSG | TRNAU1AP | H2AFX | 0.83661547 | 3.73E-33 |
| UCS | TSG | TRNAU1AP | GNB2L1 | 0.844862606 | 2.16E-34 |
| UCS | TSG | TRNAU1AP | AIF1 | 0.847166814 | 9.45E-35 |
| UCS | TSG | TRNAU1AP | BRMS1 | 0.84865144 | 5.51E-35 |
| UCS | TSG | TRNAU1AP | PIN1 | 0.870596442 | 9.04E-39 |
| UCS | TSG | TRNAU1AP | HTRA2 | 0.87692886 | 5.42E-40 |
| UCS | TSG | TRNAU1AP | AIP | 0.895974391 | 4.04E-44 |
| UCS | TSG | TRNAU1AP | PFN1 | 0.910820649 | 6.17E-48 |
| UVM | TSG | TRNAU1AP | PARK7 | 0.803996068 | 2.74E-19 |
Top |
|
| Protein 3D structure Visit iCn3D. |
Top |
|
| Protein-protein interaction networks * Overlap between up-regulated DEGs (log2FC<-1 and adj.P<0.05) and STRING PPI network (center: Translation factor, node: DEGs, edges: weighted by -log2(adj.P)) |
 |
| Overlap between down-regulated DEGs (log2FC>1 and adj.P<0.05) and STRING PPI network (center: Translation factor, node: DEGs, edges: weighted by -log2(adj.P)) |
 |
 * Edge colors based on TCGA cancer types. |
| * Overlap between DEGs (log2FC>1 and adj.P<0.05) and STRING PPI network per cancer (center: Translation factor, node: DEGs, node color: log2FC, edges: weighted by -log2(adj.P)) |
 |
| Cancer type | Translation factor | Interacting protein coding gene | FC | adj.pval |
| KICH | TRNAU1AP | SNRPC | 1.31914488567847 | 0.000120222568511963 |
| LIHC | TRNAU1AP | SNRNP70 | -1.24726314691249 | 0.000131999218450268 |
| COAD | TRNAU1AP | SF3B1 | -1.80613847758886 | 0.000190287828445435 |
| HNSC | TRNAU1AP | SNRNP70 | -1.39678280201819 | 0.000333792391984389 |
| PRAD | TRNAU1AP | SNRPA1 | -1.07177192796564 | 0.000389431583638804 |
| COAD | TRNAU1AP | PRPF39 | -3.45961025960099 | 0.000524610280990601 |
| BRCA | TRNAU1AP | SEPSECS | -1.49569251700223 | 0.000941794422102645 |
| COAD | TRNAU1AP | PSTK | -2.83493023793761 | 0.00197160243988037 |
| LUSC | TRNAU1AP | PSTK | -1.10450833392405 | 0.00201130880831994 |
| PRAD | TRNAU1AP | PSTK | 1.42484344304779 | 0.00312472017787764 |
| CHOL | TRNAU1AP | SEPSECS | -1.79794121924099 | 0.00390625 |
| ESCA | TRNAU1AP | SNRPA1 | -1.16441200959288 | 0.0068359375 |
| PRAD | TRNAU1AP | SNRNP70 | -1.92025110361916 | 0.0130781232419534 |
| ESCA | TRNAU1AP | SNRPD3 | -1.34158239045332 | 0.013671875 |
| BLCA | TRNAU1AP | SF3B1 | -1.83735297760829 | 0.0206589639990262 |
| COAD | TRNAU1AP | SEPSECS | -1.79606545257874 | 0.023610919713974 |
| LIHC | TRNAU1AP | SECISBP2 | -1.75320478083999 | 0.0244988885611231 |
| READ | TRNAU1AP | EEFSEC | -2.14513057008022 | 0.03125 |
| READ | TRNAU1AP | SNRNP70 | -1.94959373395684 | 0.03125 |
| COAD | TRNAU1AP | EEFSEC | -9.71610086929807 | 1.59740447998047e-05 |
| LUSC | TRNAU1AP | SNRNP70 | -1.66676302684772 | 1.65402843598856e-05 |
| STAD | TRNAU1AP | SNRPA1 | -1.31996994244749 | 1.73319131135941e-06 |
| KIRP | TRNAU1AP | SNRPD3 | 1.11820860964659 | 2.66358256340027e-06 |
| HNSC | TRNAU1AP | SNRPA1 | -1.74788780464001 | 5.60817215955468e-06 |
| COAD | TRNAU1AP | SNRNP70 | -4.05487077987472 | 5.66244125366212e-07 |
| PRAD | TRNAU1AP | SECISBP2 | 1.87774240131642 | 5.80245434965193e-05 |
| KIRC | TRNAU1AP | PSTK | 2.45946657502431 | 7.59244533881681e-10 |
| BRCA | TRNAU1AP | SNRPC | -2.40402221553371 | 9.39298818048331e-22 |
| STAD | TRNAU1AP | SNRNP70 | -1.29682459133379 | 9.4762071967125e-07 |
| Protein-protein interactors with this translation factor (BIOGRID-3.4.160) |
| PPI interactors with TRNAU1AP |
| CAND1, LMNB2, PRPF39, ZG16B, BRCA1, APOOL, CENPW, CTNNBL1, FDPS, LUC7L3, PELO, SKA3, KDM6B, TP63, ITFG1, DDX58, SLC25A15, HELZ, ZBTB20, EXPH5, MTO1, SLC25A4, TIMMDC1, SLC25A16, PKP2, ATXN2, BCAS2, QKI, GTSE1, USP10, DMRTB1, RBM42, SECISBP2, PRRC2B, Ssbp1, 2700060E02Rik, Nudt21, Htatsf1, |
Top |
|
| Clinically associated variants from ClinVar. |
| Gene | Chr | Position | RefSeq | VarSeq | RefSeeq | VarType | Pathogenic | Disease | VarInfo |
| nsSNVs with sample frequency (size of circle) from TCGA 33 cancers. |
 |
| SNVs and Indels |
| Gene | Cancer type | Chromosome | Start | End | RefSeeq | MutSeq | Mutation type | AAchange | # samples |
| TRNAU1AP | BRCA | chr1 | 28904895 | 28904896 | - | ACTT | RNA | NULL | 4 |
| TRNAU1AP | BRCA | chr1 | 28880170 | 28880170 | G | T | Nonsense_Mutation | p.E16* | 4 |
| TRNAU1AP | BRCA | chr1 | 28904118 | 28904118 | A | T | Silent | p.T278 | 3 |
| TRNAU1AP | UCS | chr1 | 28897731 | 28897731 | A | G | Missense_Mutation | p.S192G | 3 |
| TRNAU1AP | ESCA | chr1 | 28897783 | 28897783 | A | G | Missense_Mutation | p.Y209C | 3 |
| TRNAU1AP | PAAD | chr1 | 28891240 | 28891240 | G | T | Missense_Mutation | p.D102Y | 3 |
| TRNAU1AP | UCEC | chr1 | 28887186 | 28887186 | C | T | Missense_Mutation | p.A56V | 2 |
| TRNAU1AP | UCEC | chr1 | 28887750 | 28887750 | G | C | RNA | NULL | 2 |
| TRNAU1AP | CESC | chr1 | 28897738 | 28897738 | A | C | Missense_Mutation | 2 | |
| TRNAU1AP | LUAD | chr1 | 28880162 | 28880162 | A | G | Missense_Mutation | p.Y13C | 2 |
| TRNAU1AP | UCEC | chr1 | 28897727 | 28897727 | T | G | Missense_Mutation | p.S190R | 2 |
| TRNAU1AP | SARC | chr1 | 28887176 | 28887176 | G | T | Missense_Mutation | 2 | |
| TRNAU1AP | CESC | chr1 | 28904068 | 28904068 | G | A | Missense_Mutation | 2 | |
| TRNAU1AP | UCEC | chr1 | 28897780 | 28897780 | G | A | Missense_Mutation | p.G208D | 2 |
| TRNAU1AP | SARC | chr1 | 28904058 | 28904058 | G | T | Missense_Mutation | 2 | |
| TRNAU1AP | SARC | chr1 | 28904058 | 28904058 | G | T | Missense_Mutation | p.M258I | 2 |
| TRNAU1AP | PAAD | chr1 | 28891240 | 28891240 | G | T | Missense_Mutation | 2 | |
| TRNAU1AP | BLCA | chr1 | 28898397 | 28898397 | G | C | Missense_Mutation | p.D238H | 2 |
| TRNAU1AP | SKCM | chr1 | 28904082 | 28904082 | C | T | Silent | p.D266D | 2 |
| TRNAU1AP | BRCA | chr1 | 28904191 | 28904192 | GA | - | RNA | NULL | 2 |
| TRNAU1AP | ESCA | chr1 | 28897783 | 28897783 | A | G | Missense_Mutation | 2 | |
| TRNAU1AP | LIHC | chr1 | 28904033 | 28904033 | T | C | Missense_Mutation | 1 | |
| TRNAU1AP | UCEC | chr1 | 28891254 | 28891254 | C | T | Silent | p.D106D | 1 |
| TRNAU1AP | READ | chr1 | 28880172 | 28880172 | G | T | Missense_Mutation | p.E16D | 1 |
| TRNAU1AP | SKCM | chr1 | 28887878 | 28887878 | C | A | Missense_Mutation | p.N82K | 1 |
| TRNAU1AP | LIHC | chr1 | 28893884 | 28893884 | G | - | Frame_Shift_Del | p.L163fs | 1 |
| TRNAU1AP | READ | chr1 | 28893924 | 28893924 | G | A | Missense_Mutation | p.A177T | 1 |
| TRNAU1AP | TGCT | chr1 | 28891260 | 28891260 | T | C | Silent | 1 | |
| TRNAU1AP | LIHC | chr1 | 28880202 | 28880202 | G | - | Frame_Shift_Del | p.M26fs | 1 |
| TRNAU1AP | SARC | chr1 | 28879629 | 28879629 | G | T | Missense_Mutation | 1 | |
| TRNAU1AP | THYM | chr1 | 28879627 | 28879627 | C | T | Missense_Mutation | 1 | |
| TRNAU1AP | THYM | chr1 | 28893924 | 28893924 | G | T | Missense_Mutation | 1 | |
| TRNAU1AP | OV | chr1 | 28770319 | 28770319 | G | C | Missense_Mutation | 1 | |
| TRNAU1AP | SARC | chr1 | 28897732 | 28897732 | G | T | Missense_Mutation | 1 | |
| TRNAU1AP | CESC | chr1 | 28897738 | 28897738 | A | C | Missense_Mutation | p.N194T | 1 |
| TRNAU1AP | THYM | chr1 | 28893908 | 28893908 | C | T | Silent | 1 | |
| TRNAU1AP | OV | chr1 | 28777579 | 28777579 | T | C | RNA | NULL | 1 |
| TRNAU1AP | UCS | chr1 | 28897731 | 28897731 | A | G | Missense_Mutation | 1 | |
| TRNAU1AP | BLCA | chr1 | 28898397 | 28898397 | G | C | Missense_Mutation | 1 | |
| TRNAU1AP | CESC | chr1 | 28904068 | 28904068 | G | A | Missense_Mutation | p.E262K | 1 |
| TRNAU1AP | THYM | chr1 | 28879627 | 28879627 | C | T | Missense_Mutation | p.A2V | 1 |
| TRNAU1AP | OV | chr1 | 28763886 | 28763886 | C | T | Silent | p.P121 | 1 |
| TRNAU1AP | BLCA | chr1 | 28887162 | 28887162 | G | A | Missense_Mutation | 1 | |
| TRNAU1AP | COAD | chr1 | 28891260 | 28891260 | T | C | Silent | p.D108D | 1 |
| TRNAU1AP | THYM | chr1 | 28893924 | 28893924 | G | T | Missense_Mutation | p.A177S | 1 |
| TRNAU1AP | THYM | chr1 | 28887162 | 28887162 | G | T | Missense_Mutation | p.C48F | 1 |
| TRNAU1AP | PAAD | chr1 | 28880217 | 28880217 | G | T | Missense_Mutation | 1 | |
| TRNAU1AP | BLCA | chr1 | 28887162 | 28887162 | G | A | Missense_Mutation | p.C48Y | 1 |
| TRNAU1AP | SKCM | chr1 | 28891336 | 28891336 | G | A | Missense_Mutation | p.G134S | 1 |
| TRNAU1AP | ESCA | chr1 | 28904175 | 28904177 | ATG | - | RNA | NULL | 1 |
| TRNAU1AP | THYM | chr1 | 28893908 | 28893908 | C | T | Silent | p.S171S | 1 |
| TRNAU1AP | SKCM | chr1 | 28880232 | 28880232 | C | T | Silent | p.I36I | 1 |
| TRNAU1AP | UCEC | chr1 | 28904041 | 28904041 | G | A | Missense_Mutation | p.A253T | 1 |
| TRNAU1AP | PRAD | chr1 | 28891266 | 28891266 | C | T | Silent | p.G110G | 1 |
| TRNAU1AP | SKCM | chr1 | 28880233 | 28880233 | C | T | Nonsense_Mutation | p.R37* | 1 |
| Copy number variation (CNV) of TRNAU1AP * Click on the image to open the original image in a new window. |
 |
| Fusion gene breakpoints (product of the structural variants (SVs)) across TRNAU1AP * Click on the image to open the UCSC genome browser with custom track showing this image in a new window. |
 |
| Fusion genes with this translation factor from FusionGDB2.0. |
| FusionGDB2 ID | Disease | Sample | Hgene | Hchr | Hbp | Hstrand | Tgene | Tchr | Tbp | Tstrand |
| 85965 | N/A | AA360336 | CYP20A1 | chr2 | 204169478 | + | TRNAU1AP | chr1 | 28899769 | - |
| 85965 | OV | TCGA-24-1544-01A | EPB41 | chr1 | 29241280 | + | TRNAU1AP | chr1 | 28880152 | + |
| 85965 | BLCA | TCGA-DK-A6B2 | GMEB1 | chr1 | 29019557 | + | TRNAU1AP | chr1 | 28887144 | + |
| 85965 | BLCA | TCGA-DK-A6B2-01A | GMEB1 | chr1 | 29019557 | + | TRNAU1AP | chr1 | 28887145 | + |
| 85965 | BRCA | TCGA-A7-A26G | GMEB1 | chr1 | 28995351 | + | TRNAU1AP | chr1 | 28897687 | + |
| 85965 | BRCA | TCGA-A7-A26G-01A | GMEB1 | chr1 | 28995351 | + | TRNAU1AP | chr1 | 28897688 | + |
| 85965 | OV | TCGA-24-2023 | GMEB1 | chr1 | 28995351 | + | TRNAU1AP | chr1 | 28898378 | + |
| 85965 | OV | TCGA-24-2023-01A | GMEB1 | chr1 | 28995351 | + | TRNAU1AP | chr1 | 28898379 | + |
| 85965 | N/A | BE008614 | KIF26B | chr1 | 245349460 | - | TRNAU1AP | chr1 | 28893865 | + |
| 85965 | N/A | BE008620 | KIF26B | chr1 | 245349463 | - | TRNAU1AP | chr1 | 28893865 | + |
| 85965 | KIRC | TCGA-B0-5119-01A | NOL9 | chr1 | 6601890 | - | TRNAU1AP | chr1 | 28904012 | + |
| 85965 | KIRC | TCGA-B0-5119-01A | NOL9 | chr1 | 6609631 | - | TRNAU1AP | chr1 | 28904012 | + |
| 85965 | STAD | TCGA-BR-4357 | PHACTR4 | chr1 | 28733974 | + | TRNAU1AP | chr1 | 28880151 | + |
| 85965 | STAD | TCGA-CD-8525-01A | PHACTR4 | chr1 | 28696336 | + | TRNAU1AP | chr1 | 28897688 | + |
| 85965 | Non-Cancer | TCGA-IC-A6RE-11A | RCC1 | chr1 | 28832596 | + | TRNAU1AP | chr1 | 28891214 | + |
| 85969 | N/A | AW298043 | SPOP | chr17 | 47677549 | + | TRNAU1AP | chr1 | 28904053 | + |
| 94329 | N/A | AA745507 | TRNAU1AP | chr1 | 28902056 | + | EPB41 | chr1 | 29374809 | + |
| 94329 | KIRC | TCGA-B0-5119-01A | TRNAU1AP | chr1 | 28898412 | + | NOL9 | chr1 | 6593501 | - |
| 94329 | BRCA | TCGA-AO-A1KR-01A | TRNAU1AP | chr1 | 28880249 | - | PHACTR4 | chr1 | 28800066 | + |
| 94329 | COAD | TCGA-D5-6931 | TRNAU1AP | chr1 | 28880249 | + | PTPRU | chr1 | 29618380 | + |
| 94329 | COAD | TCGA-D5-6931-01A | TRNAU1AP | chr1 | 28880249 | + | PTPRU | chr1 | 29618381 | + |
| 94329 | BRCA | TCGA-C8-A134-01A | TRNAU1AP | chr1 | 28893925 | + | RCC1 | chr1 | 28861562 | + |
| 100607 | Non-Cancer | 91N | TRNAU1AP | chr1 | 28887244 | + | TIA1 | chr2 | 70441626 | - |
| 102496 | N/A | EC491219 | TRNAU1AP | chr1 | 28884337 | - | UBE2L3 | chr22 | 21951023 | - |
Top |
|
| Kaplan-Meier plots with logrank tests of overall survival (OS) |
 |
| Cancer type | Translation factor | Coefficent | Hazard ratio | Wald test pval | Likelihool ratio pval | Logrank test pval | # samples |
Top |
|
| Differential gene expression between female and male. (Wilcoxon test, pval<0.05) |
 |
| Cancer type | Translation factor | pval | adj.p |
| LIHC | TRNAU1AP | 0.00310349881382595 | 0.087 |
| LUSC | TRNAU1AP | 0.0114689480784761 | 0.31 |
| GBM | TRNAU1AP | 0.0206211061607904 | 0.54 |
| LUAD | TRNAU1AP | 0.0276109408750993 | 0.69 |
| BRCA | TRNAU1AP | 0.0333637056735481 | 0.8 |
Top |
|
| Differential gene expression between young and old age groups (Wilcoxon test, pval<0.05) |
| Cancer type | Translation factor | pval | adj.p |
| LIHC | TRNAU1AP | 0.0196477001685819 | 0.61 |
| BRCA | TRNAU1AP | 0.000916240740555251 | 0.03 |
| HNSC | TRNAU1AP | 0.0144453591196445 | 0.46 |
Top |
|
| Drugs targeting genes involved in this translation factor. (DrugBank Version 5.1.8 2021-05-08) |
| UniProtAcc | DrugBank ID | Drug name | Drug activity | Drug type | Drug status |
Top |
|
| Diseases associated with this translation factor. (DisGeNet 4.0) |
| Disease ID | Disease Name | # PubMeds | Disease source |
(UTHealth)
Web File Viewing | Emergency Information |Campus Carry|Site Policies