
|
||||||
|

Translation Factor: RBM3 (NCBI Gene ID:5935) |
|
 Gene Summary Gene Summary |
| Gene Information | Gene Name: RBM3 | Gene ID: 5935 | Gene Symbol | RBM3 | Gene ID | 5935 |
| Gene Name | RNA binding motif protein 3 | |
| Synonyms | IS1-RNPL|RNPL | |
| Cytomap | Xp11.23 | |
| Type of Gene | protein-coding | |
| Description | RNA-binding protein 3RNA binding motif (RNP1, RRM) protein 3 | |
| Modification date | 20200327 | |
| UniProtAcc | P98179 | |
| Child GO biological process term(s) under GO:0006412 |
| GO ID | GO term |
| GO:0006417 | Regulation of translation |
| GO:0045727 | Positive regulation of translation |
| GO:0006412 | Translation |
| Gene ontology of translaction factor with evidence of Inferred from Direct Assay (IDA) from Entrez |
| Partner | Gene | GO ID | GO term | PubMed ID |
| Inferred gene age of translation factor. |
| Gene | Inferred gene age group among (0 - 67.6], (67.6 - 355.7], (355.7 - 733], (733 - 1119.25], >1119.25 |
| RBM3 | (0 - 67.6] |
Top |
|
| We searched PubMed using 'RBM3[title] AND translation [title] AND human.' |
| Gene | Title | PMID |
| RBM3 | Translation regulatory factor RBM3 is a proto-oncogene that prevents mitotic catastrophe | 18427544 |
Top |
|
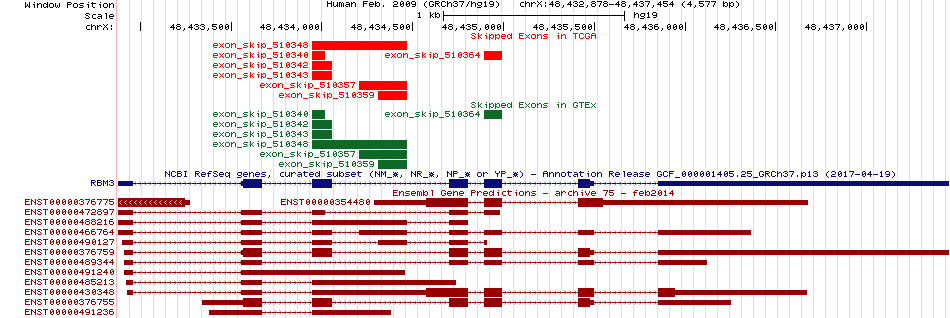
| Skipped exons in TCGA and GTEx based on Ensembl gene isoform structure. * Click on the image to open the UCSC genome browser with custom track showing this image in a new window. For more annotations, please visit our ExonSkipDB. |
 |
| Open reading frame (ORF) analsis of exon skipping events based on Ensembl gene isoform structure. * Click on the break point to see the gene structure around the break point region using the UCSC Genome Browser. |
| ENST | Exon skip start (DNA) | Exon Skip end (DNA) | ORF |
| ENST00000376755 | 48433948 | 48434055 | Frame-shift |
| ENST00000376759 | 48433948 | 48434055 | Frame-shift |
| ENST00000376755 | 48434895 | 48434992 | Frame-shift |
| ENST00000376759 | 48434895 | 48434992 | Frame-shift |
| Exon skipping position in the amino acid sequence. |
| ENST | Exon skip start (DNA) | Exon Skip end (DNA) | Len(transcript seq) | Exon skip start (mRNA) | Exon Skip end (mRNA) | Len(amino acid seq) | Exon skip start (AA) | Exon Skip end (AA) |
| Potentially (partially) lost protein functional features of UniProt. |
| UniProtAcc | Exon skip start (AA) | Exon Skip end (AA) | Function feature start (AA) | Function feature end (AA) | Functional feature type | Functional feature desc. |
Top |
|
| Gene expression level across TCGA pancancer |
 |
| Gene expression level across GTEx pantissue |
 |
| Expression level of gene isoforms across TCGA pancancer |
 |
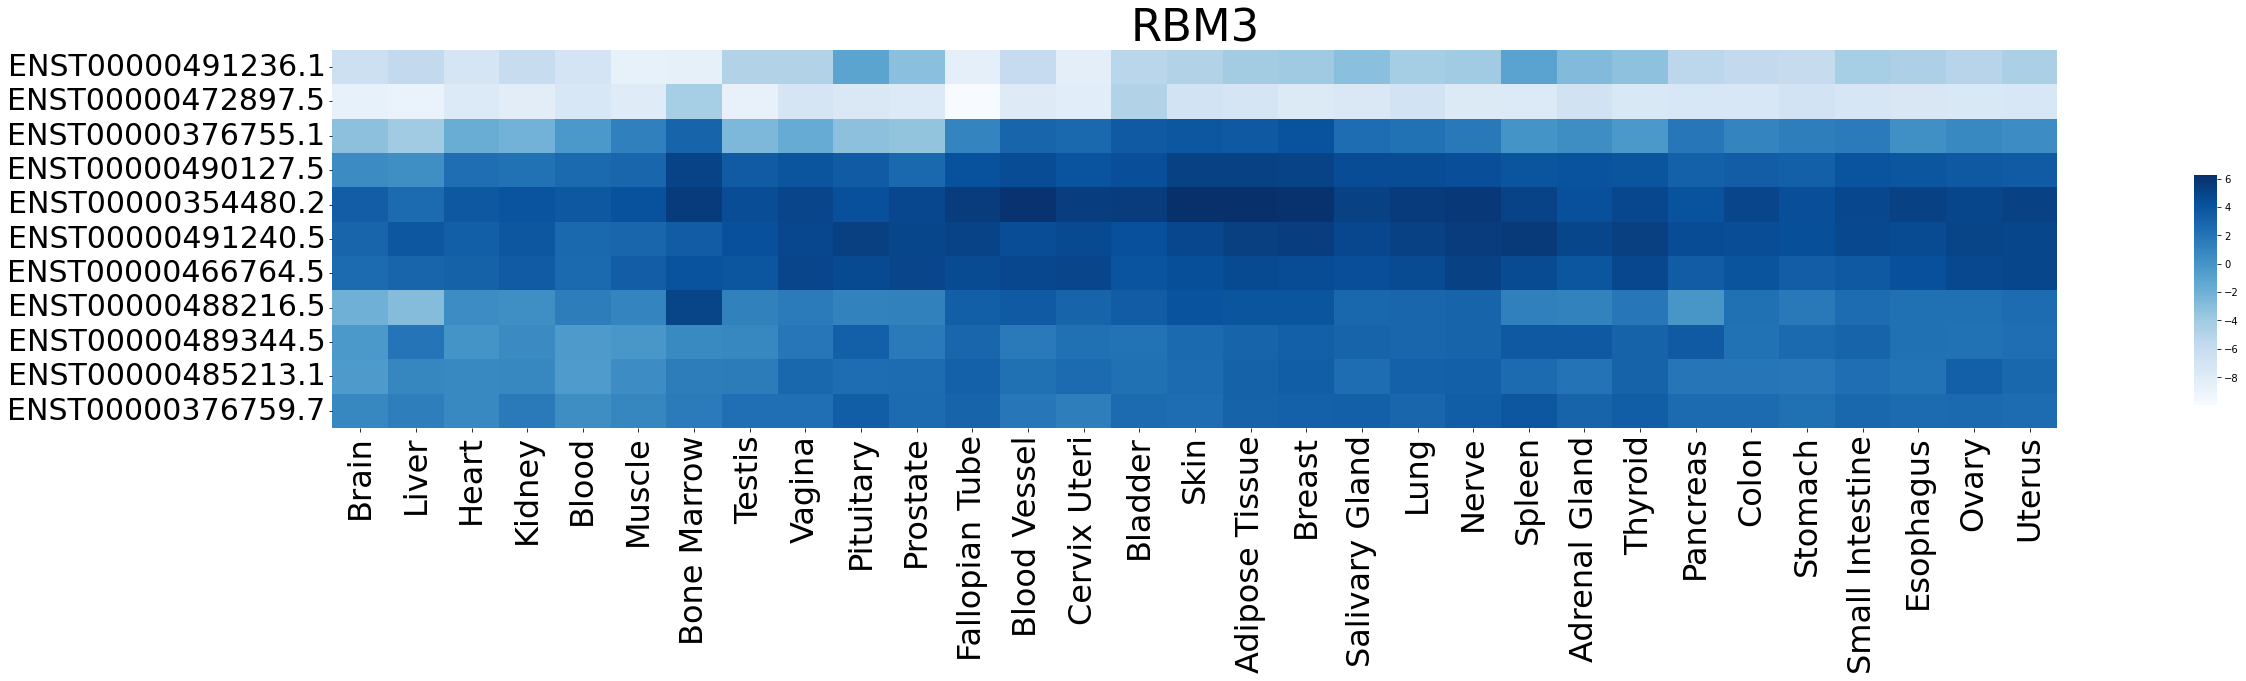
| Expression level of gene isoforms across GTEx pantissue |
 |
| Cancer(tissue) type-specific expression level of Translation factor using z-score distriution |
 |
| Differential expression between tumor and matched normal (in the cancer types with more than 10 matched samples) |
 |
| Cancer type | Translation factor | FC | adj.pval |
| KIRP | RBM3 | -1.20995338615735 | 0.00143672106787562 |
| THCA | RBM3 | -2.38501042455464 | 0.00194539641764689 |
| KICH | RBM3 | -1.95587244315451 | 0.0482624173164368 |
| LIHC | RBM3 | -1.38936602853842 | 8.97466888721789e-06 |
Top |
|
| Translation factor expression regulation through miRNA binding |
| Cancer type | Gene | miRNA | TargetScan binding score (Context++ score percentile) | Coefficient | Pvalue |
| DLBC | RBM3 | hsa-miR-410-3p | 77 | 0.370374653098982 | 0.0107926422492362 |
| Translation factor expression regulation through methylation in the promoter of Translation factor |
 |
| Cancer type | Gene | methyl group b | methyl group a | DEG pval | avg methyl in b | avg methyl in a | avg exp in b | avg exp in a |
| Translation factor expression regulation through methylation in the gene body of Translation factor (positive regulation) |
 |
| Cancer type | Gene | methyl group b | methyl group a | DEG pval | avg methyl in b | avg methyl in a | avg exp in b | avg exp in a |
| Translation factor expression regulation through copy number variation of Translation factor |
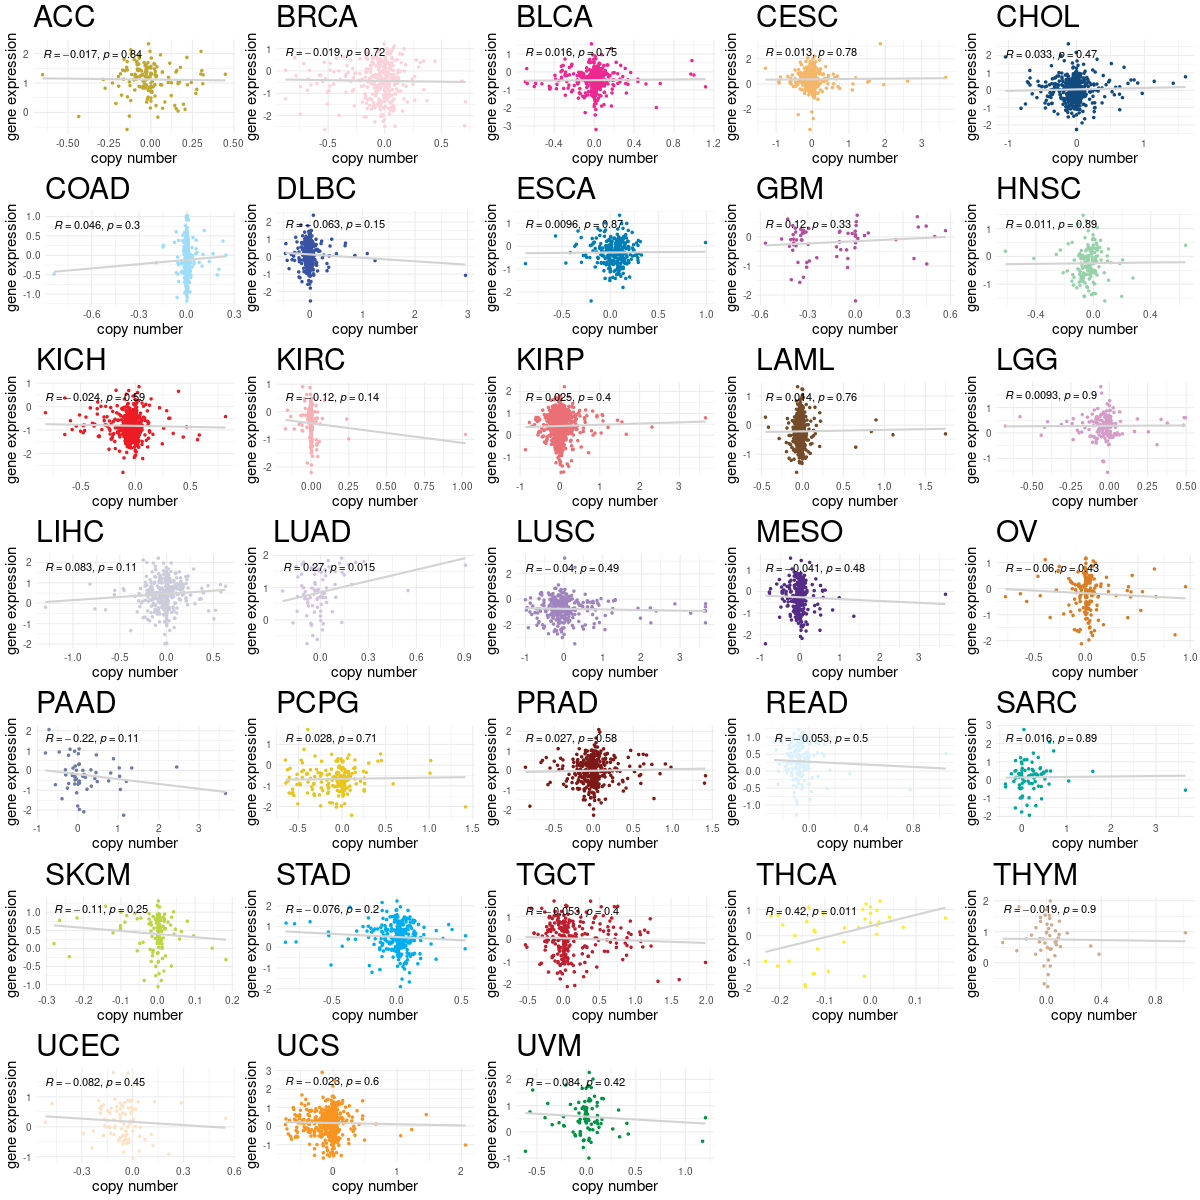 |
| Cancer type | Gene | Coefficient | Pvalue |
| THCA | RBM3 | 0.04126265 | 0.010867233 |
| LUAD | RBM3 | 0.062883328 | 0.014953106 |
Top |
|
| Strongly correlated genes belong to cellular important gene groups with RBM3 (coefficient>0.8, pval<0.05, node color based on FC between tumor and matched normal). Significantly associated important genes in the individual cancer types. * Cell metabolism gene: cell metabolism genes from REACTOME (black edge), IUPHAR: drug target genes from IUPHAR (blue edge), Kinase: human kinase genes (brown edge), CGC: cancer gene census genes (orange edge), TSG: tumor suppresor genes (purple edge), Epifactor: epigenetic factors (light blue edge), TF: transcription factors (green) |
 |
| Cancer type | Gene group | Translation factor | Correlated gene | Coefficient | Pvalue |
| CHOL | Cell metabolism gene | RBM3 | SLC44A2 | 0.801048244 | 3.90E-11 |
| CHOL | Cell metabolism gene | RBM3 | INPP5J | 0.80159766 | 3.69E-11 |
| CHOL | Cell metabolism gene | RBM3 | PLCD3 | 0.802008919 | 3.55E-11 |
| CHOL | Cell metabolism gene | RBM3 | ARF3 | 0.804069401 | 2.90E-11 |
| CHOL | Cell metabolism gene | RBM3 | PAFAH1B3 | 0.808058922 | 1.94E-11 |
| CHOL | Cell metabolism gene | RBM3 | PFKP | 0.822015927 | 4.45E-12 |
| CHOL | Cell metabolism gene | RBM3 | ITPR3 | 0.823701398 | 3.69E-12 |
| CHOL | Cell metabolism gene | RBM3 | TEAD4 | 0.838217613 | 6.79E-13 |
| CHOL | Cell metabolism gene | RBM3 | LCMT1 | 0.841618267 | 4.46E-13 |
| CHOL | CGC | RBM3 | ERCC3 | 0.8095444 | 1.67E-11 |
| CHOL | CGC | RBM3 | ZNF384 | 0.811026817 | 1.43E-11 |
| CHOL | CGC | RBM3 | SMARCA4 | 0.813216014 | 1.14E-11 |
| CHOL | CGC | RBM3 | FLNA | 0.82235568 | 4.29E-12 |
| CHOL | CGC | RBM3 | ELF4 | 0.822543832 | 4.20E-12 |
| CHOL | Epifactor | RBM3 | SMARCA4 | 0.813216014 | 1.14E-11 |
| CHOL | Epifactor | RBM3 | HCFC1 | 0.816863551 | 7.78E-12 |
| CHOL | Epifactor | RBM3 | ATN1 | 0.820890999 | 5.03E-12 |
| CHOL | Epifactor | RBM3 | CTBP2 | 0.822434163 | 4.25E-12 |
| CHOL | Epifactor | RBM3 | ZNF711 | 0.828426441 | 2.17E-12 |
| CHOL | Epifactor | RBM3 | HMGN4 | 0.831514326 | 1.51E-12 |
| CHOL | Epifactor | RBM3 | HDAC7 | 0.842673609 | 3.90E-13 |
| CHOL | Epifactor | RBM3 | SRCAP | 0.858916261 | 4.45E-14 |
| CHOL | IUPHAR | RBM3 | BACE2 | 0.800422578 | 4.14E-11 |
| CHOL | IUPHAR | RBM3 | LIMK1 | 0.800585099 | 4.08E-11 |
| CHOL | IUPHAR | RBM3 | SLC44A2 | 0.801048244 | 3.90E-11 |
| CHOL | IUPHAR | RBM3 | INPP5J | 0.80159766 | 3.69E-11 |
| CHOL | IUPHAR | RBM3 | PLCD3 | 0.802008919 | 3.55E-11 |
| CHOL | IUPHAR | RBM3 | DDR1 | 0.803450677 | 3.08E-11 |
| CHOL | IUPHAR | RBM3 | NEK11 | 0.80358048 | 3.04E-11 |
| CHOL | IUPHAR | RBM3 | SLC10A3 | 0.803901139 | 2.95E-11 |
| CHOL | IUPHAR | RBM3 | SMARCA4 | 0.813216014 | 1.14E-11 |
| CHOL | IUPHAR | RBM3 | MMP11 | 0.814115955 | 1.04E-11 |
| CHOL | IUPHAR | RBM3 | MFSD5 | 0.814220767 | 1.03E-11 |
| CHOL | IUPHAR | RBM3 | STK39 | 0.815741853 | 8.76E-12 |
| CHOL | IUPHAR | RBM3 | SLC38A1 | 0.821456979 | 4.73E-12 |
| CHOL | IUPHAR | RBM3 | ITPR3 | 0.823701398 | 3.69E-12 |
| CHOL | IUPHAR | RBM3 | IKBKE | 0.827597745 | 2.38E-12 |
| CHOL | IUPHAR | RBM3 | S100A11 | 0.833995032 | 1.13E-12 |
| CHOL | IUPHAR | RBM3 | HDAC7 | 0.842673609 | 3.90E-13 |
| CHOL | IUPHAR | RBM3 | ORAI2 | 0.859854438 | 3.89E-14 |
| CHOL | IUPHAR | RBM3 | LPAR2 | 0.867689815 | 1.23E-14 |
| CHOL | IUPHAR | RBM3 | ITGB4 | 0.877300133 | 2.68E-15 |
| CHOL | Kinase | RBM3 | LIMK1 | 0.800585099 | 4.08E-11 |
| CHOL | Kinase | RBM3 | DDR1 | 0.803450677 | 3.08E-11 |
| CHOL | Kinase | RBM3 | NEK11 | 0.80358048 | 3.04E-11 |
| CHOL | Kinase | RBM3 | ABR | 0.809127656 | 1.74E-11 |
| CHOL | Kinase | RBM3 | STK39 | 0.815741853 | 8.76E-12 |
| CHOL | Kinase | RBM3 | IKBKE | 0.827597745 | 2.38E-12 |
| CHOL | TF | RBM3 | ZBTB45 | 0.800962797 | 3.93E-11 |
| CHOL | TF | RBM3 | ZNF384 | 0.811026817 | 1.43E-11 |
| CHOL | TF | RBM3 | FBXL19 | 0.812487882 | 1.23E-11 |
| CHOL | TF | RBM3 | ELF4 | 0.822543832 | 4.20E-12 |
| CHOL | TF | RBM3 | ZNF711 | 0.828426441 | 2.17E-12 |
| CHOL | TF | RBM3 | NFE2L3 | 0.830200834 | 1.76E-12 |
| CHOL | TF | RBM3 | TEAD4 | 0.838217613 | 6.79E-13 |
| CHOL | TF | RBM3 | SRCAP | 0.858916261 | 4.45E-14 |
| CHOL | TSG | RBM3 | GAS5 | 0.80133446 | 3.79E-11 |
| CHOL | TSG | RBM3 | DOK1 | 0.804453716 | 2.79E-11 |
| CHOL | TSG | RBM3 | SPINT2 | 0.808383136 | 1.88E-11 |
| CHOL | TSG | RBM3 | BEX2 | 0.811446164 | 1.37E-11 |
| CHOL | TSG | RBM3 | SMARCA4 | 0.813216014 | 1.14E-11 |
| CHOL | TSG | RBM3 | FLNA | 0.82235568 | 4.29E-12 |
| CHOL | TSG | RBM3 | PHLDA3 | 0.829284625 | 1.96E-12 |
| CHOL | TSG | RBM3 | S100A11 | 0.833995032 | 1.13E-12 |
Top |
|
| Protein 3D structure Visit iCn3D. |
Top |
|
| Protein-protein interaction networks * Overlap between up-regulated DEGs (log2FC<-1 and adj.P<0.05) and STRING PPI network (center: Translation factor, node: DEGs, edges: weighted by -log2(adj.P)) |
 |
| Overlap between down-regulated DEGs (log2FC>1 and adj.P<0.05) and STRING PPI network (center: Translation factor, node: DEGs, edges: weighted by -log2(adj.P)) |
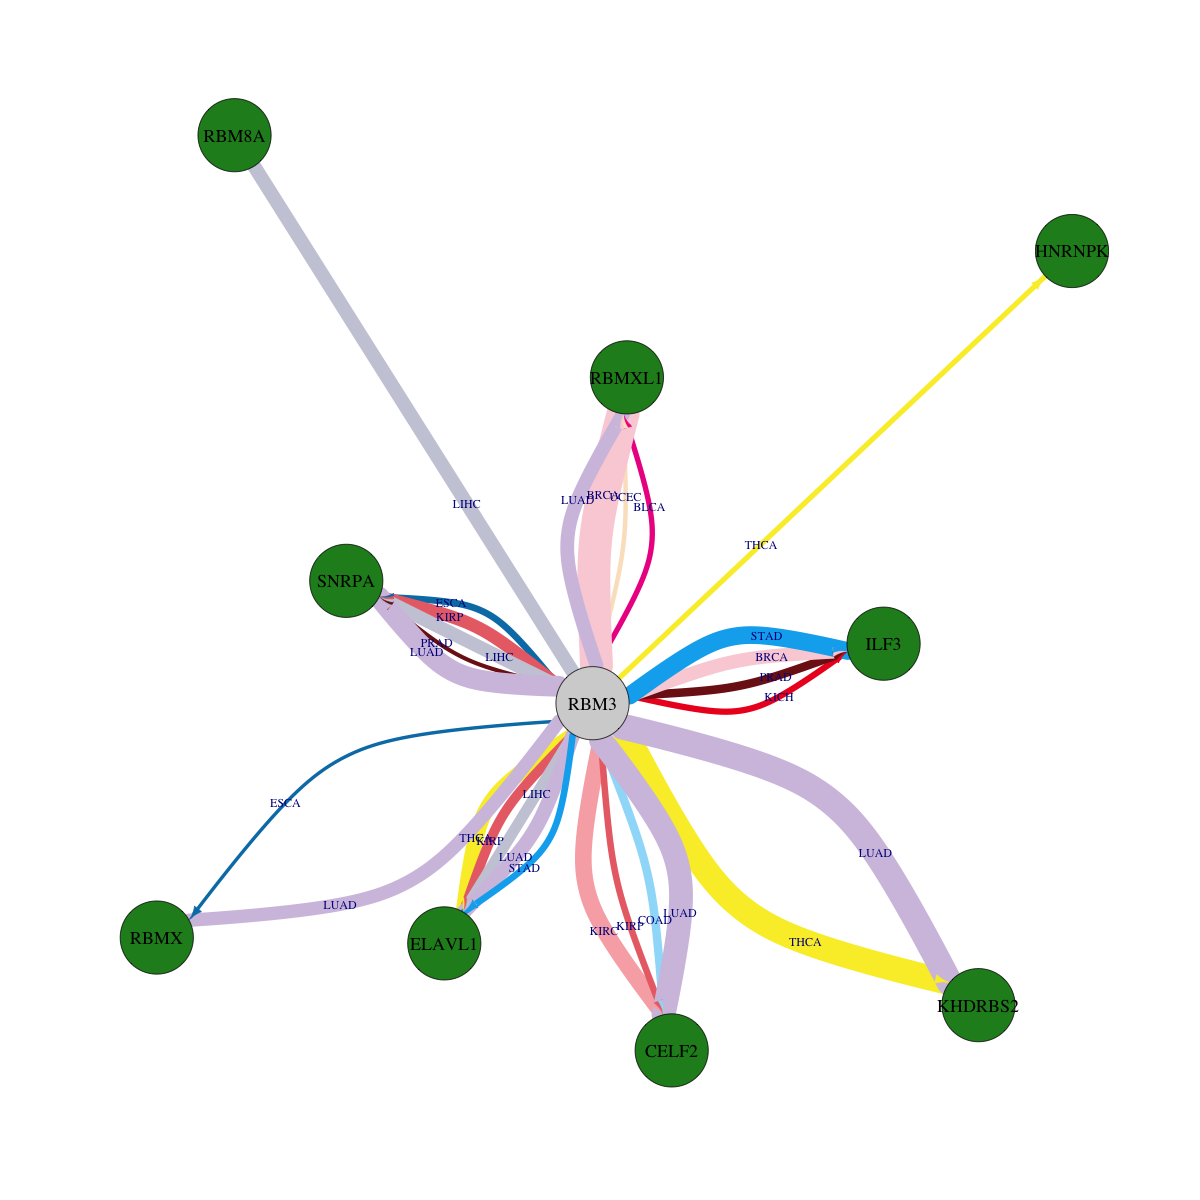 |
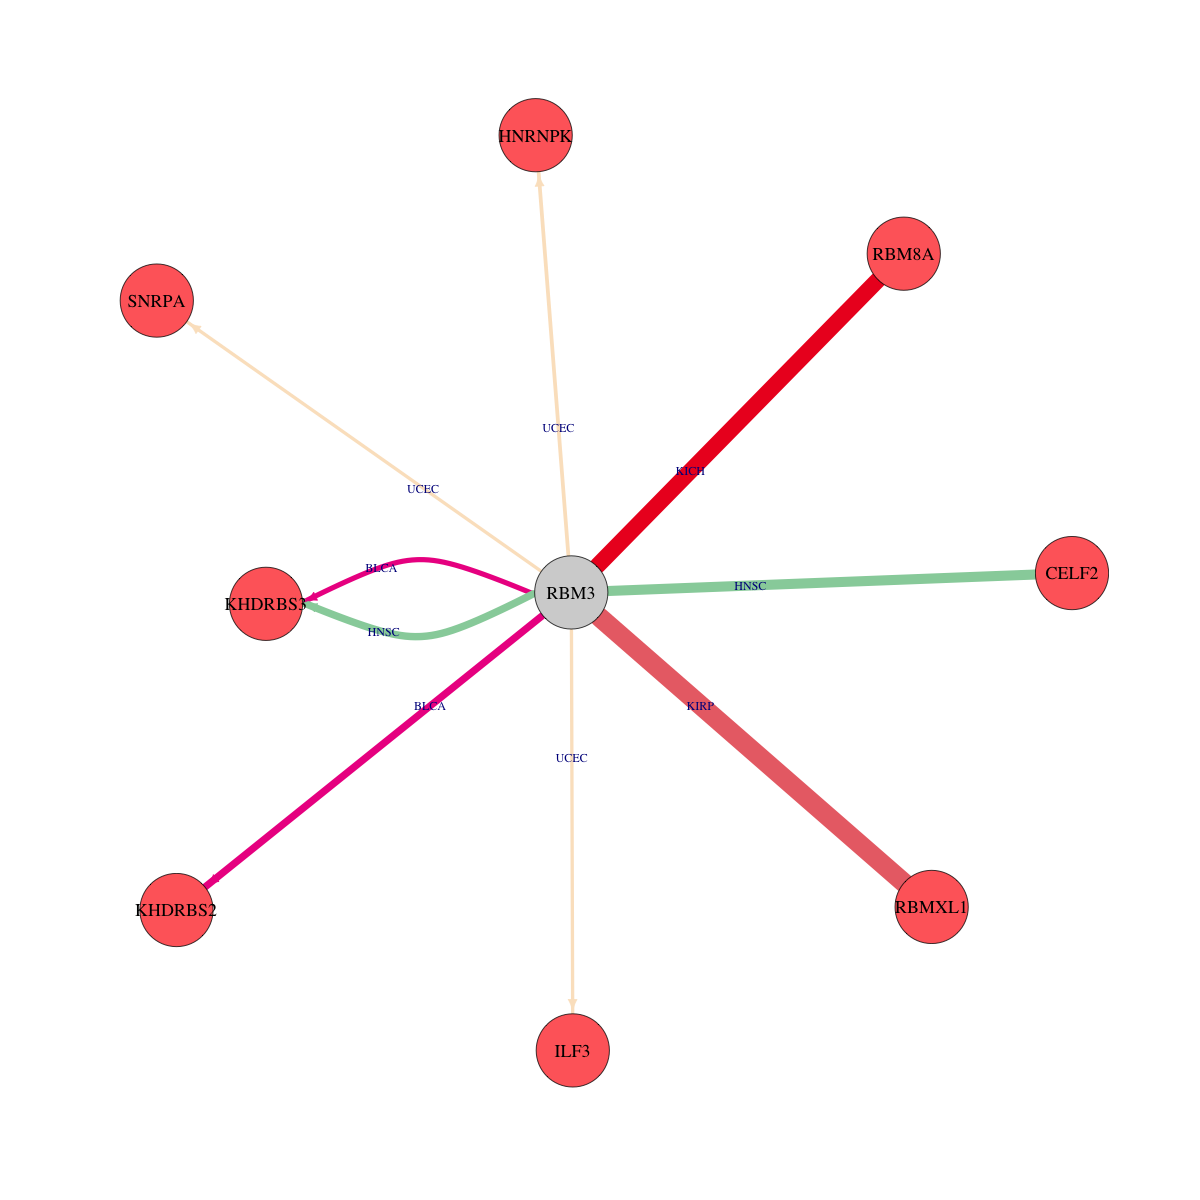
 * Edge colors based on TCGA cancer types. |
| * Overlap between DEGs (log2FC>1 and adj.P<0.05) and STRING PPI network per cancer (center: Translation factor, node: DEGs, node color: log2FC, edges: weighted by -log2(adj.P)) |
 |
| Cancer type | Translation factor | Interacting protein coding gene | FC | adj.pval |
| KIRP | RBM3 | ELAVL1 | -2.08200657251054 | 0.000110303983092308 |
| PRAD | RBM3 | ILF3 | -1.66399002266096 | 0.000376184722398862 |
| COAD | RBM3 | CELF2 | -1.57597866852104 | 0.000411599874496461 |
| HNSC | RBM3 | KHDRBS3 | 1.55903583693905 | 0.00106627625814326 |
| BLCA | RBM3 | KHDRBS2 | 3.42430670691912 | 0.00123013955537317 |
| ESCA | RBM3 | SNRPA | -3.71939307836743 | 0.001953125 |
| STAD | RBM3 | ELAVL1 | -2.10141075100184 | 0.00222697434946895 |
| KIRP | RBM3 | CELF2 | -1.40535936407291 | 0.00239070039242506 |
| KICH | RBM3 | ILF3 | -1.08690451087032 | 0.00308787822723389 |
| BLCA | RBM3 | RBMXL1 | -1.61810491586908 | 0.00714492797851562 |
| THCA | RBM3 | HNRNPK | -8.73422542563389 | 0.00797530353045887 |
| BLCA | RBM3 | KHDRBS3 | 2.13453443940609 | 0.00823211669921875 |
| UCEC | RBM3 | RBMXL1 | -2.72233327753721 | 0.015625 |
| PRAD | RBM3 | SNRPA | -2.99222999291193 | 0.0219987445973693 |
| UCEC | RBM3 | HNRNPK | 1.64532744504864 | 0.03125 |
| ESCA | RBM3 | RBMX | -1.33271218858293 | 0.0419921875 |
| UCEC | RBM3 | ILF3 | 1.60315027085684 | 0.046875 |
| UCEC | RBM3 | SNRPA | 1.4162366960911 | 0.046875 |
| KIRP | RBM3 | RBMXL1 | 1.77239748451654 | 1.53668224811554e-08 |
| LUAD | RBM3 | ELAVL1 | -1.15327309311237 | 1.64690017573449e-06 |
| KIRC | RBM3 | CELF2 | -2.97375876446357 | 2.12552477559147e-07 |
| LIHC | RBM3 | RBM8A | -3.06006403111345 | 2.58704546629954e-06 |
| LUAD | RBM3 | CELF2 | -1.17703282695879 | 2.79010927055879e-10 |
| LUAD | RBM3 | RBMXL1 | -5.24661866017254 | 2.91985910758098e-06 |
| KICH | RBM3 | RBM8A | 2.62055927587015 | 2.98023223876953e-07 |
| BRCA | RBM3 | ILF3 | -1.25150240382867 | 3.29730506460964e-06 |
| LIHC | RBM3 | ELAVL1 | -1.11474497929122 | 3.60241778081952e-05 |
| LUAD | RBM3 | KHDRBS2 | -1.77012295492985 | 3.79251210274868e-11 |
| LIHC | RBM3 | SNRPA | -1.48880962162522 | 4.13231748257069e-06 |
| LUAD | RBM3 | SNRPA | -1.36395233835103 | 4.39225939988757e-09 |
| LUAD | RBM3 | RBMX | -3.50261144388893 | 4.40678669801292e-06 |
| THCA | RBM3 | ELAVL1 | -1.75446983004742 | 5.71717197842929e-07 |
| BRCA | RBM3 | RBMXL1 | -4.0029281381374 | 6.48351744106718e-14 |
| KIRP | RBM3 | SNRPA | -1.04126636141457 | 6.79492950439454e-06 |
| THCA | RBM3 | KHDRBS2 | -1.21153859817019 | 7.50861561019654e-11 |
| STAD | RBM3 | ILF3 | -2.09020109679651 | 7.8696757555008e-08 |
| HNSC | RBM3 | CELF2 | 2.14699709882165 | 9.12882633201663e-05 |
| Protein-protein interactors with this translation factor (BIOGRID-3.4.160) |
| PPI interactors with RBM3 |
| CHAF1A, UBC, CUL3, CUL4B, CUL5, CUL2, CDK2, CUL1, COPS5, DCUN1D1, CAND1, MRPL12, HNRNPA1, PSMA7, EEF1A1, FN1, IL7R, ITGA4, TP53, HNRNPK, RBMY1A1, SNRPA, RBMX, RBMY1F, KHDRBS2, MOV10, RPL10, MATR3, Rpl35, Taf15, Rrbp1, Srsf1, Fus, MCM2, RC3H1, ELAVL1, YARS2, SUPV3L1, MCAT, PAIP2B, NAGK, NGRN, THUMPD3, NIF3L1, AARS2, PRMT5, UPF1, FAM120A, IGF2BP2, FAP, DNM2, CDV3, MRPS31, TCEB2, SF3A2, PTCD1, ELAVL2, CASC3, CHRNE, YWHAE, CALCA, NCBP2, USP34, CCT4, TROVE2, KLHDC10, ILF3, RPA1, DAP3, WDR74, MRPS9, IGF2BP3, ILF2, UBR3, NFKBIZ, MRPS28, TCEB1, TTN, FLYWCH2, MAGOH, CCT3, FABP5, KIF27, MRPL1, MRPL52, JUP, KIAA0195, PRKRA, DDX60L, RALYL, C3orf70, CHM, RPL39, MRPS18B, AP1G2, CDKN2AIPNL, MRPS6, ZCCHC3, RBP3, RBM8A, EFTUD2, SPDL1, MEPCE, LARP7, REST, KIAA1429, RC3H2, PHB, USP14, HIST1H4A, APEX1, RARA, MAB21L2, SNRNP70, SRSF3, KHDRBS3, CHTOP, RBPMS2, PCBP1, MYPOP, PRR3, RBMY1J, FANCD2, ZC3H18, LCK, RAB5A, ORF8, ESR1, DUX4, CIT, DDX58, DDRGK1, FZR1, MAP4K2, DHX36, PAPSS2, FASTKD2, KLHL24, PRMT6, PRMT8, PRMT1, HNRNPA0, HNRNPR, HNRNPLL, Hnrnpk, Cirbp, Hnrnpu, Ube2i, Srsf3, Pcbp1, Rbm14, |
Top |
|
| Clinically associated variants from ClinVar. |
| Gene | Chr | Position | RefSeq | VarSeq | RefSeeq | VarType | Pathogenic | Disease | VarInfo |
| nsSNVs with sample frequency (size of circle) from TCGA 33 cancers. |
 |
| SNVs and Indels |
| Gene | Cancer type | Chromosome | Start | End | RefSeeq | MutSeq | Mutation type | AAchange | # samples |
| RBM3 | COAD | chrX | 48434786 | 48434786 | C | T | Missense_Mutation | p.R99C | 3 |
| RBM3 | UCEC | chrX | 48434775 | 48434775 | G | A | Missense_Mutation | p.G95E | 3 |
| RBM3 | LIHC | chrX | 48433627 | 48433627 | A | T | Missense_Mutation | 3 | |
| RBM3 | UCEC | chrX | 48433958 | 48433958 | T | G | Missense_Mutation | p.V38G | 2 |
| RBM3 | ACC | chrX | 48433575 | 48433575 | T | A | Missense_Mutation | p.S3T | 2 |
| RBM3 | SARC | chrX | 48434970 | 48434970 | C | T | Missense_Mutation | 2 | |
| RBM3 | ESCA | chrX | 48433656 | 48433656 | G | A | Missense_Mutation | p.G30R | 2 |
| RBM3 | UCEC | chrX | 48433980 | 48433980 | G | A | Silent | p.R45 | 2 |
| RBM3 | SARC | chrX | 48434970 | 48434970 | C | T | Missense_Mutation | p.R131C | 2 |
| RBM3 | UCEC | chrX | 48435516 | 48435516 | C | T | Missense_Mutation | p.A145V | 2 |
| RBM3 | BRCA | chrX | 48434030 | 48434030 | T | A | Missense_Mutation | p.V62D | 2 |
| RBM3 | SKCM | chrX | 48433953 | 48433953 | C | T | Silent | p.V36V | 2 |
| RBM3 | KICH | chrX | 48434802 | 48434802 | C | T | Missense_Mutation | p.S104F | 2 |
| RBM3 | CESC | chrX | 48434778 | 48434778 | C | T | Missense_Mutation | 2 | |
| RBM3 | KIRP | chrX | 48434994 | 48434994 | T | G | Splice_Site | p.R138_splice | 2 |
| RBM3 | TGCT | chrX | 48434994 | 48434994 | T | G | Splice_Site | 2 | |
| RBM3 | READ | chrX | 48434980 | 48434980 | A | T | Missense_Mutation | p.D134V | 1 |
| RBM3 | LIHC | chrX | 48433584 | 48433584 | G | A | Missense_Mutation | 1 | |
| RBM3 | SARC | chrX | 48433977 | 48433977 | G | T | Missense_Mutation | 1 | |
| RBM3 | ESCA | chrX | 48433709 | 48433709 | G | C | RNA | NULL | 1 |
| RBM3 | LIHC | chrX | 48434688 | 48434688 | T | C | Missense_Mutation | 1 | |
| RBM3 | ACC | chrX | 48433575 | 48433575 | T | A | Translation_Start_Site | 1 | |
| RBM3 | GBM | chrX | 48433596 | 48433596 | G | C | Missense_Mutation | p.V10L | 1 |
| RBM3 | LIHC | chrX | 48435528 | 48435528 | C | A | Missense_Mutation | 1 | |
| RBM3 | SARC | chrX | 48434476 | 48434476 | G | T | RNA | NULL | 1 |
| RBM3 | KICH | chrX | 48434802 | 48434802 | C | T | Missense_Mutation | 1 | |
| RBM3 | LIHC | chrX | 48434040 | 48434040 | A | G | Silent | p.R65R | 1 |
| RBM3 | CESC | chrX | 48434595 | 48434595 | C | T | Missense_Mutation | 1 | |
| RBM3 | LIHC | chrX | 48433627 | 48433627 | A | T | Missense_Mutation | p.Q20L | 1 |
| RBM3 | SKCM | chrX | 48433611 | 48433611 | T | C | Missense_Mutation | p.F15L | 1 |
| RBM3 | KIRC | chrX | 48434991 | 48434992 | - | G | Frame_Shift_Ins | p.R138fs | 1 |
| RBM3 | LIHC | chrX | 48434629 | 48434629 | C | - | Frame_Shift_Del | p.T19fs | 1 |
| RBM3 | CESC | chrX | 48433595 | 48433595 | C | T | Silent | 1 | |
| RBM3 | STAD | chrX | 48433596 | 48433596 | G | A | Missense_Mutation | p.V10M | 1 |
| RBM3 | LUAD | chrX | 48435468 | 48435468 | C | A | Missense_Mutation | p.D156E | 1 |
| RBM3 | CESC | chrX | 48433775 | 48433775 | C | T | RNA | NULL | 1 |
| RBM3 | KIRP | chrX | 48434952 | 48434952 | T | G | Missense_Mutation | p.Y125D | 1 |
| RBM3 | LUSC | chrX | 48433599 | 48433599 | G | T | Nonsense_Mutation | p.G11* | 1 |
| RBM3 | CESC | chrX | 48434070 | 48434070 | C | T | RNA | NULL | 1 |
| RBM3 | THYM | chrX | 48433993 | 48433993 | G | T | Missense_Mutation | 1 | |
| RBM3 | KIRP | chrX | 48434010 | 48434010 | C | A | Silent | 1 | |
| RBM3 | PCPG | chrX | 48433969 | 48433969 | G | T | Missense_Mutation | 1 | |
| RBM3 | CESC | chrX | 48434778 | 48434778 | C | T | Missense_Mutation | p.P69S | 1 |
| RBM3 | THYM | chrX | 48433993 | 48433993 | G | T | Missense_Mutation | p.G50C | 1 |
| RBM3 | LGG | chrX | 48434900 | 48434900 | T | C | Missense_Mutation | 1 |
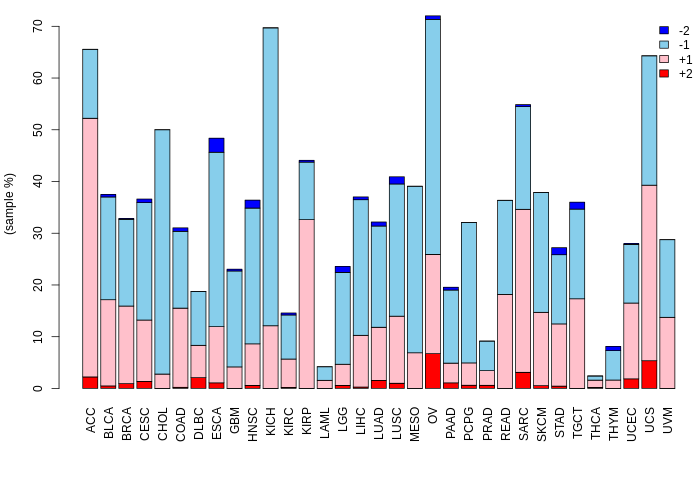
| Copy number variation (CNV) of RBM3 * Click on the image to open the original image in a new window. |
 |
| Fusion gene breakpoints (product of the structural variants (SVs)) across RBM3 * Click on the image to open the UCSC genome browser with custom track showing this image in a new window. |
 |
| Fusion genes with this translation factor from FusionGDB2.0. |
| FusionGDB2 ID | Disease | Sample | Hgene | Hchr | Hbp | Hstrand | Tgene | Tchr | Tbp | Tstrand |
| 86748 | N/A | AA564516 | ARHGAP24 | chr4 | 86497591 | + | RBM3 | chrX | 48436388 | + |
| 86748 | ESCA | TCGA-L5-A8NE | LYZ | chr12 | 69747259 | + | RBM3 | chrX | 48436435 | + |
| 86748 | ESCA | TCGA-L5-A8NE | LYZ | chr12 | 69747265 | + | RBM3 | chrX | 48436441 | + |
| 86748 | N/A | AY358132 | NEGR1 | chr1 | 71872026 | - | RBM3 | chrX | 48434920 | + |
| 86748 | N/A | CB051146 | NXPH1 | chr7 | 8696157 | + | RBM3 | chrX | 48439550 | - |
| 102857 | N/A | AA177057 | RBM3 | chrX | 48436672 | + | CHMP1A | chr16 | 89717175 | + |
| 102173 | BRCA | TCGA-A2-A4S1-01A | RBM3 | chrX | 48434090 | + | COL1A1 | chr17 | 48264909 | - |
| 80868 | N/A | BU676293 | RBM3 | chrX | 48436439 | - | F3 | chr1 | 94995621 | + |
| 88711 | N/A | AA329557 | RBM3 | chrX | 48434003 | + | ILK | chr11 | 6630374 | + |
| 102694 | N/A | CA433037 | RBM3 | chrX | 48436476 | - | NME7 | chr1 | 169102012 | + |
| 98486 | N/A | ES316009 | RBM3 | chrX | 48436340 | - | NXN | chr17 | 811551 | - |
| 90923 | N/A | BG576987 | RBM3 | chrX | 48436679 | + | OTUD5 | chrX | 48788239 | + |
| 86748 | N/A | BF340733 | RBM3 | chrX | 48436065 | + | RBM3 | chrX | 48436050 | - |
| 86748 | N/A | H20596 | RBM3 | chrX | 48438802 | + | RBM3 | chrX | 48436436 | + |
| 82901 | N/A | AA465493 | RBM3 | chrX | 48436377 | - | SIKE1 | chr1 | 115313470 | + |
| 86748 | N/A | AK125614 | SECISBP2 | chr9 | 91973037 | + | RBM3 | chrX | 48434778 | + |
| 86748 | STAD | TCGA-CD-8525-01A | SLC25A51 | chr9 | 37880664 | - | RBM3 | chrX | 48436377 | + |
| 86752 | STAD | TCGA-FP-8211-01A | SSFA2 | chr2 | 182781154 | + | RBM3 | chrX | 48433556 | + |
Top |
|
| Kaplan-Meier plots with logrank tests of overall survival (OS) |
 |
| Cancer type | Translation factor | Coefficent | Hazard ratio | Wald test pval | Likelihool ratio pval | Logrank test pval | # samples |
Top |
|
| Differential gene expression between female and male. (Wilcoxon test, pval<0.05) |
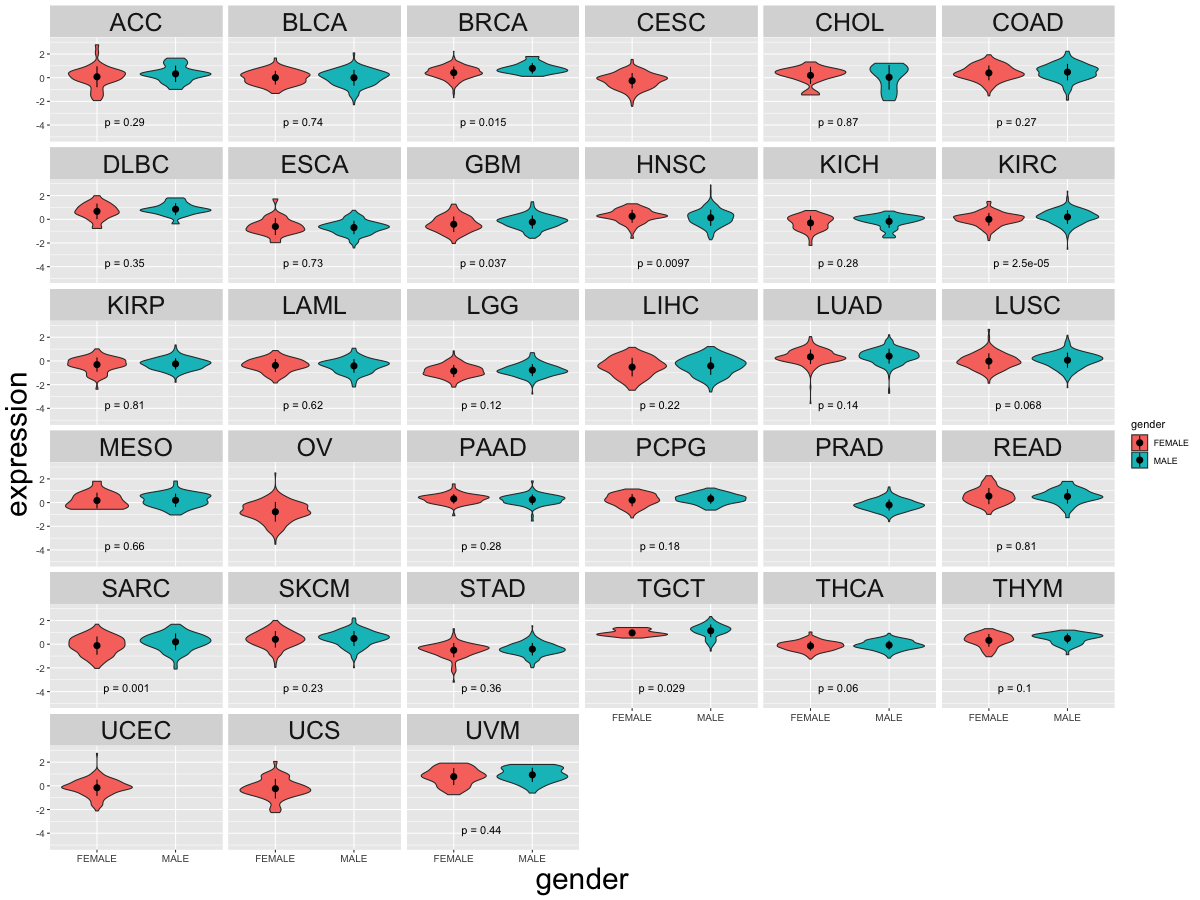 |
| Cancer type | Translation factor | pval | adj.p |
| SARC | RBM3 | 0.00103236906796522 | 0.028 |
| HNSC | RBM3 | 0.00969847629538153 | 0.25 |
| BRCA | RBM3 | 0.015377418835284 | 0.38 |
| TGCT | RBM3 | 0.0285514727422302 | 0.69 |
| GBM | RBM3 | 0.0374196121287031 | 0.86 |
| KIRC | RBM3 | 2.45915447049639e-05 | 0.00069 |
Top |
|
| Differential gene expression between young and old age groups (Wilcoxon test, pval<0.05) |
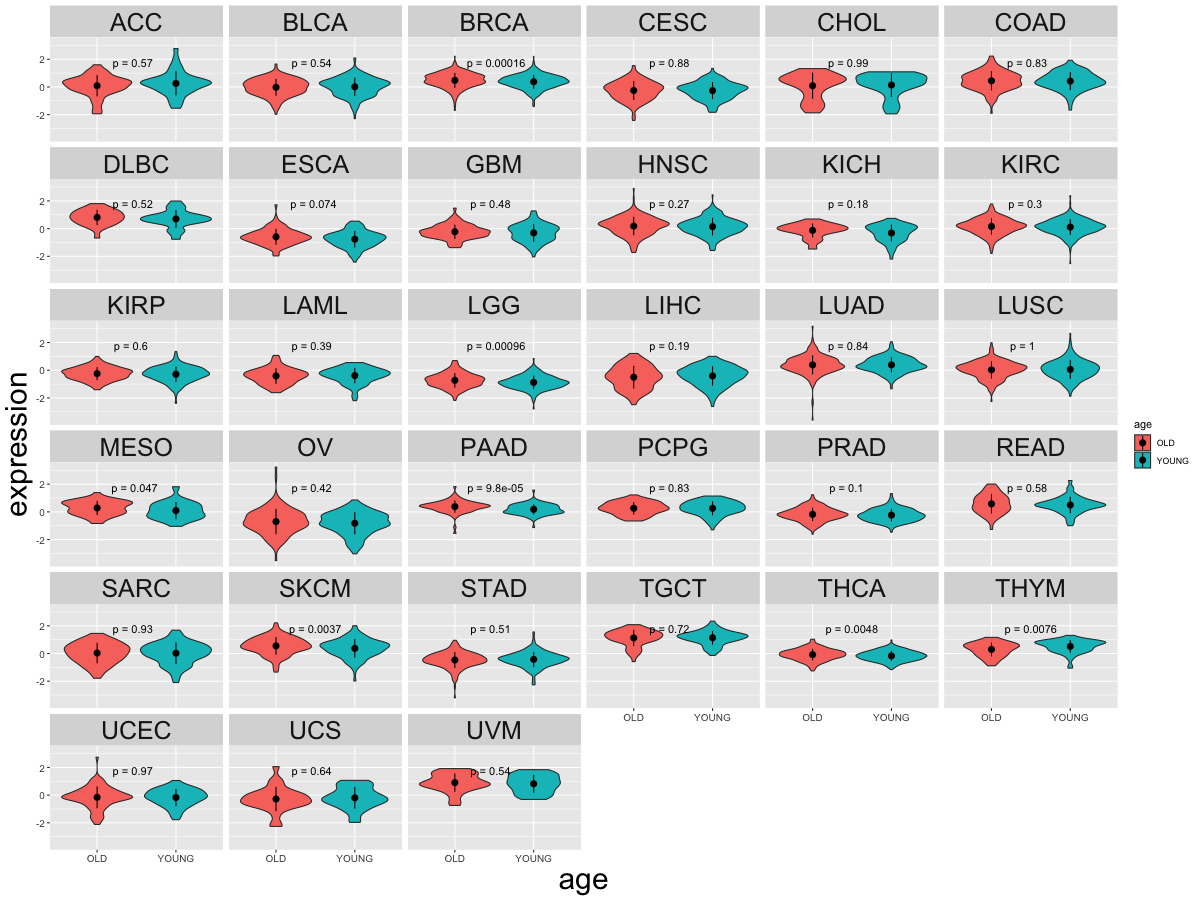 |
| Cancer type | Translation factor | pval | adj.p |
| THCA | RBM3 | 0.00478650137626868 | 0.14 |
| LGG | RBM3 | 0.000963527194181093 | 0.03 |
| BRCA | RBM3 | 0.000155105315992742 | 0.005 |
| PAAD | RBM3 | 9.76675036790893e-05 | 0.0032 |
| SKCM | RBM3 | 0.00370710032712976 | 0.11 |
| THYM | RBM3 | 0.00764861942420988 | 0.21 |
| MESO | RBM3 | 0.0469584201319938 | 1 |
Top |
|
| Drugs targeting genes involved in this translation factor. (DrugBank Version 5.1.8 2021-05-08) |
| UniProtAcc | DrugBank ID | Drug name | Drug activity | Drug type | Drug status |
Top |
|
| Diseases associated with this translation factor. (DisGeNet 4.0) |
| Disease ID | Disease Name | # PubMeds | Disease source |
| C0006142 | Malignant neoplasm of breast | 1 | CTD_human |
| C0023893 | Liver Cirrhosis, Experimental | 1 | CTD_human |
| C0678222 | Breast Carcinoma | 1 | CTD_human |
| C1257931 | Mammary Neoplasms, Human | 1 | CTD_human |
| C4704874 | Mammary Carcinoma, Human | 1 | CTD_human |
(UTHealth)
Web File Viewing | Emergency Information |Campus Carry|Site Policies