
|
||||||
|

Translation Factor: RPL9 (NCBI Gene ID:6133) |
|
 Gene Summary Gene Summary |
| Gene Information | Gene Name: RPL9 | Gene ID: 6133 | Gene Symbol | RPL9 | Gene ID | 6133 |
| Gene Name | ribosomal protein L9 | |
| Synonyms | L9|NPC-A-16 | |
| Cytomap | 4p14 | |
| Type of Gene | protein-coding | |
| Description | 60S ribosomal protein L9large ribosomal subunit protein uL6 | |
| Modification date | 20200322 | |
| UniProtAcc | P32969 | |
| Child GO biological process term(s) under GO:0006412 |
| GO ID | GO term |
| Gene ontology of translaction factor with evidence of Inferred from Direct Assay (IDA) from Entrez |
| Partner | Gene | GO ID | GO term | PubMed ID |
| Inferred gene age of translation factor. |
| Gene | Inferred gene age group among (0 - 67.6], (67.6 - 355.7], (355.7 - 733], (733 - 1119.25], >1119.25 |
| RPL9 | >1119.25 |
Top |
|
| We searched PubMed using 'RPL9[title] AND translation [title] AND human.' |
| Gene | Title | PMID |
| RPL9 | . | . |
Top |
|
| Skipped exons in TCGA and GTEx based on Ensembl gene isoform structure. * Click on the image to open the UCSC genome browser with custom track showing this image in a new window. For more annotations, please visit our ExonSkipDB. |
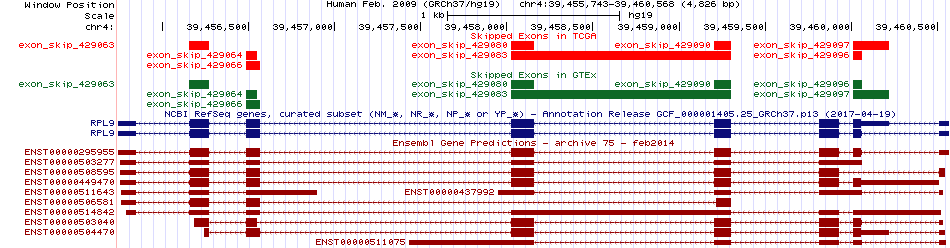 |
| Open reading frame (ORF) analsis of exon skipping events based on Ensembl gene isoform structure. * Click on the break point to see the gene structure around the break point region using the UCSC Genome Browser. |
| ENST | Exon skip start (DNA) | Exon Skip end (DNA) | ORF |
| Exon skipping position in the amino acid sequence. |
| ENST | Exon skip start (DNA) | Exon Skip end (DNA) | Len(transcript seq) | Exon skip start (mRNA) | Exon Skip end (mRNA) | Len(amino acid seq) | Exon skip start (AA) | Exon Skip end (AA) |
| Potentially (partially) lost protein functional features of UniProt. |
| UniProtAcc | Exon skip start (AA) | Exon Skip end (AA) | Function feature start (AA) | Function feature end (AA) | Functional feature type | Functional feature desc. |
Top |
|
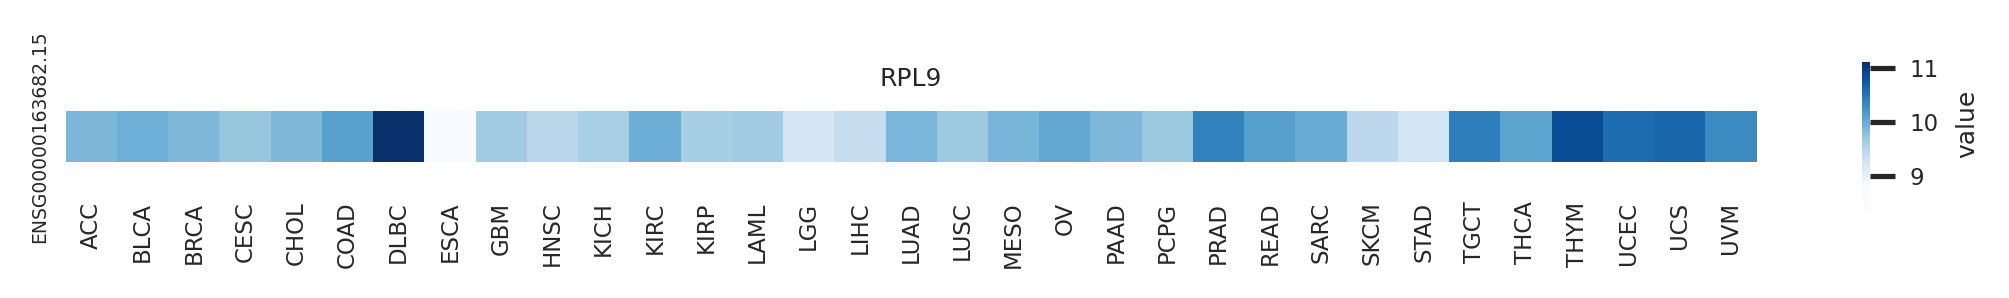
| Gene expression level across TCGA pancancer |
 |
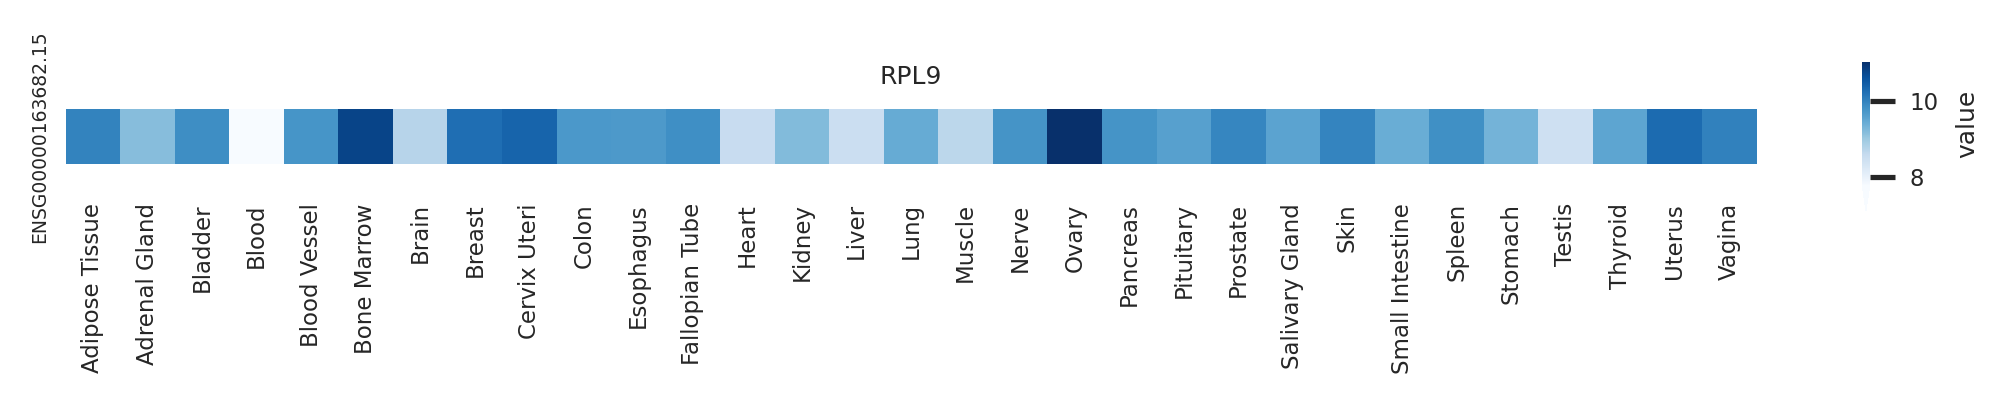
| Gene expression level across GTEx pantissue |
 |
| Expression level of gene isoforms across TCGA pancancer |
 |
| Expression level of gene isoforms across GTEx pantissue |
 |
| Cancer(tissue) type-specific expression level of Translation factor using z-score distriution |
| Differential expression between tumor and matched normal (in the cancer types with more than 10 matched samples) |
| Cancer type | Translation factor | FC | adj.pval |
| BRCA | RPL9 | -3.0134495932037 | 2.59559089925671e-05 |
Top |
|
| Translation factor expression regulation through miRNA binding |
| Cancer type | Gene | miRNA | TargetScan binding score (Context++ score percentile) | Coefficient | Pvalue |
| Translation factor expression regulation through methylation in the promoter of Translation factor |
| Cancer type | Gene | methyl group b | methyl group a | DEG pval | avg methyl in b | avg methyl in a | avg exp in b | avg exp in a |
| Translation factor expression regulation through methylation in the gene body of Translation factor (positive regulation) |
| Cancer type | Gene | methyl group b | methyl group a | DEG pval | avg methyl in b | avg methyl in a | avg exp in b | avg exp in a |
| Translation factor expression regulation through copy number variation of Translation factor |
| Cancer type | Gene | Coefficient | Pvalue |
Top |
|
| Strongly correlated genes belong to cellular important gene groups with RPL9 (coefficient>0.8, pval<0.05, node color based on FC between tumor and matched normal). Significantly associated important genes in the individual cancer types. * Cell metabolism gene: cell metabolism genes from REACTOME (black edge), IUPHAR: drug target genes from IUPHAR (blue edge), Kinase: human kinase genes (brown edge), CGC: cancer gene census genes (orange edge), TSG: tumor suppresor genes (purple edge), Epifactor: epigenetic factors (light blue edge), TF: transcription factors (green) |
| Cancer type | Gene group | Translation factor | Correlated gene | Coefficient | Pvalue |
Top |
|
| Protein 3D structure Visit iCn3D. |
Top |
|
| Protein-protein interaction networks * Overlap between up-regulated DEGs (log2FC<-1 and adj.P<0.05) and STRING PPI network (center: Translation factor, node: DEGs, edges: weighted by -log2(adj.P)) |
 |
| Overlap between down-regulated DEGs (log2FC>1 and adj.P<0.05) and STRING PPI network (center: Translation factor, node: DEGs, edges: weighted by -log2(adj.P)) |
 |
 * Edge colors based on TCGA cancer types. |
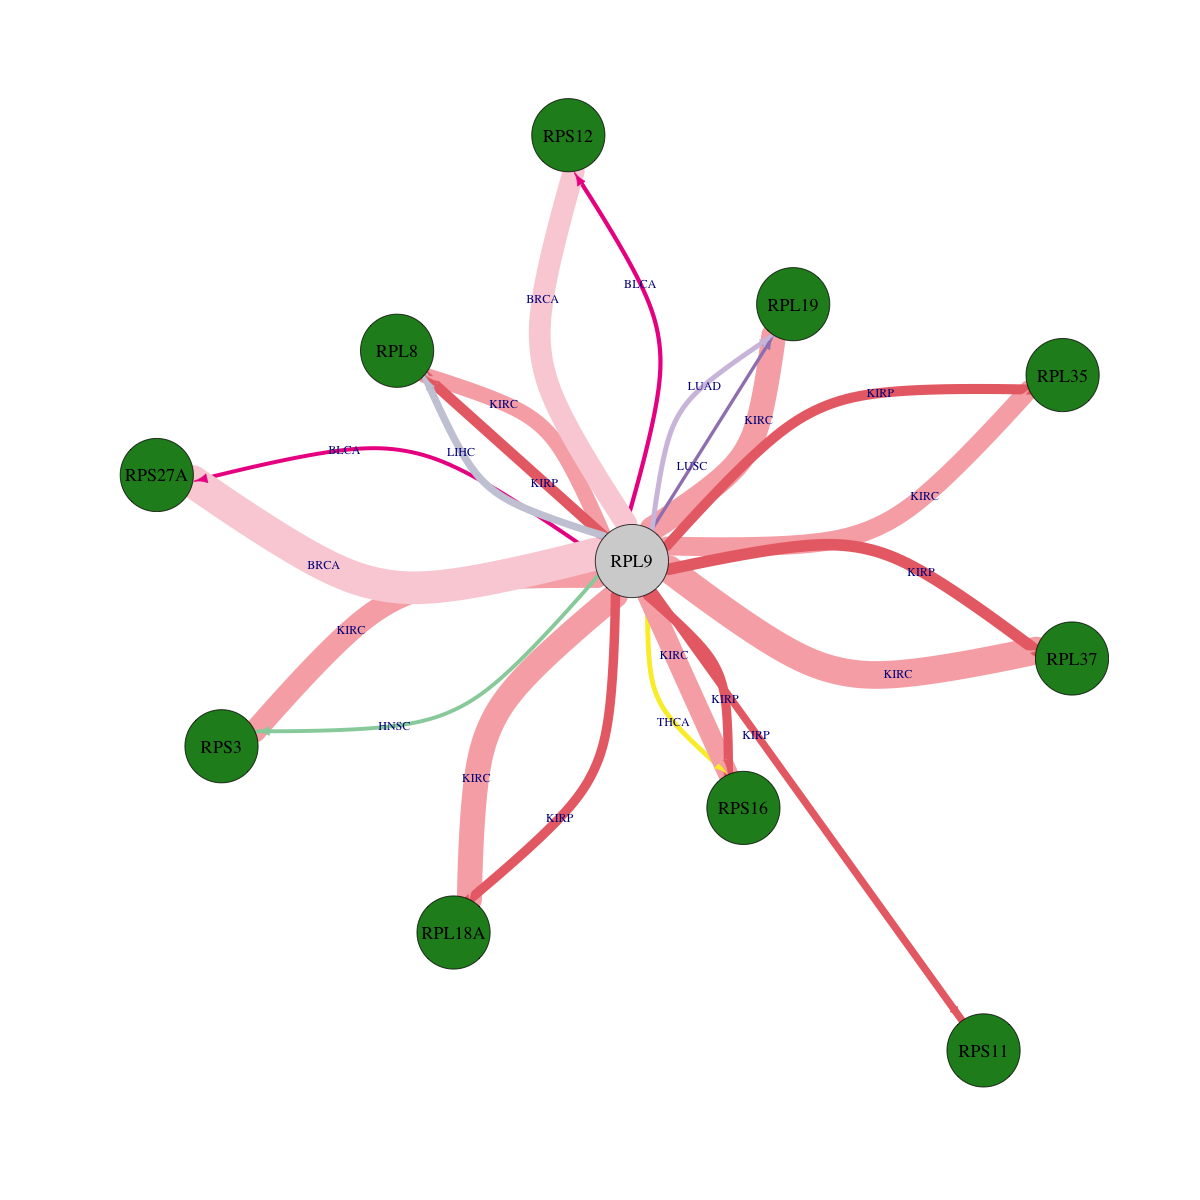
| * Overlap between DEGs (log2FC>1 and adj.P<0.05) and STRING PPI network per cancer (center: Translation factor, node: DEGs, node color: log2FC, edges: weighted by -log2(adj.P)) |
 |
| Cancer type | Translation factor | Interacting protein coding gene | FC | adj.pval |
| KIRP | RPL9 | RPL18A | -1.51651392808885 | 0.00016188295558095 |
| KICH | RPL9 | RPS27A | 1.75396693785956 | 0.000187873840332031 |
| KIRP | RPL9 | RPS16 | -1.35957043617517 | 0.00019507110118866 |
| COAD | RPL9 | RPS3 | 1.48730375143014 | 0.000411599874496461 |
| KIRP | RPL9 | RPS11 | -1.01861570565103 | 0.00105937570333481 |
| LIHC | RPL9 | RPL8 | -4.84588284974558 | 0.00110314154326131 |
| PRAD | RPL9 | RPL18A | 1.40600175748499 | 0.00205137828390396 |
| KICH | RPL9 | RPL19 | 1.36901182894089 | 0.00250792503356934 |
| KICH | RPL9 | RPS12 | 1.26997381758431 | 0.00308787822723389 |
| LUAD | RPL9 | RPL19 | -1.31398026615725 | 0.00993159558412698 |
| THCA | RPL9 | RPS16 | -6.16322798156577 | 0.0115764821363307 |
| BLCA | RPL9 | RPS12 | -1.47804673440421 | 0.0204124450683594 |
| BLCA | RPL9 | RPS27A | -1.04747470069188 | 0.0258216857910156 |
| HNSC | RPL9 | RPS3 | -4.73505819095135 | 0.0273726439852453 |
| COAD | RPL9 | RPS11 | 1.35307548998204 | 0.0312207043170929 |
| LUSC | RPL9 | RPL19 | -2.14669889516666 | 0.044366810398747 |
| KIRC | RPL9 | RPL19 | -2.73485271276676 | 1.33980982873695e-10 |
| BRCA | RPL9 | RPS12 | -4.91239327478244 | 1.85340619742495e-09 |
| KIRP | RPL9 | RPL37 | -1.17421621947139 | 2.26888805627823e-05 |
| KIRC | RPL9 | RPL35 | -1.06475238059392 | 2.72286325678163e-08 |
| KIRC | RPL9 | RPL8 | -1.18252459971773 | 5.64962994208288e-07 |
| KIRP | RPL9 | RPL8 | -1.53003692350119 | 6.0301274061203e-05 |
| KIRC | RPL9 | RPS16 | -1.66149869889384 | 7.8509870430991e-09 |
| BRCA | RPL9 | RPS27A | -4.28512148200424 | 7.8788217967112e-14 |
| KIRC | RPL9 | RPL37 | -2.87198822058464 | 8.03913394748564e-12 |
| KIRP | RPL9 | RPL35 | -1.52981101975496 | 9.0546440333128e-05 |
| KIRC | RPL9 | RPS3 | -1.29560847926387 | 9.05905681935088e-10 |
| KIRC | RPL9 | RPL18A | -4.43079304960843 | 9.2516163152192e-11 |
| Protein-protein interactors with this translation factor (BIOGRID-3.4.160) |
| PPI interactors with RPL9 |
| DHPS, SORBS2, RPS3, UBC, HDAC5, NOP56, EBNA-LP, SIRT7, CUL3, CUL4B, CUL2, CUL1, COPS5, DCUN1D1, CAND1, RPL10A, RPL10, RPL11, RPL12, RPL14, RPL15, RPL18A, RPL18, RPL19, RPL21, RPL23, RPL24, RPL27, RPL3, RPL4, RPL5, RPL6, RPL7A, RPL7, RPL8, RPS10, RPS12, RPS13, RPS14, RPS15A, RPS16, RPS20, RPS23, RPS26, RPS28, RPS2, RPS3A, RPS4X, RPS5, RPS8, RPL23A, RPS11, RPSA, RPS19, RPS6, RPS17, RPL31, RPS15, RPL37A, RPS24, RPLP0, RPL17, RPL29, RPL32, RPS21, RPS27A, EEF1A1, TUFM, NAP1L1, DHX9, ILF2, NCL, ILF3, SLC25A5, MOV10, EIF6, RPL10L, RPLP0P6, RPS27L, UQCRB, MRPS10, VASN, TXN2, HSP90AA4P, MRPS11, PLRG1, RHOT2, ESR1, FN1, VCAM1, UBL4A, ITGA4, PAN2, IGSF8, ICAM1, TARDBP, RPA3, RPA2, RPA1, STAU1, FUS, TRIM37, VCP, ZBTB14, CALCOCO2, PNMA2, MTUS2, ZBTB7B, HOMEZ, KXD1, HMBOX1, CEP76, TIFA, FAM9B, SPERT, CCDC184, ZBTB8A, CUL7, CCDC8, EED, RNF2, EEFSEC, MRPL16, MRPL22, RBM34, RPL27A, RPL35A, RPL38, RPL39, CDC5L, DDX18, DDX27, FBL, FTSJ3, POLR1A, POLR1B, RPL13, RPL13A, RPL22, RPL30, RPL34, RPL35, RPL36, RPL3L, RPLP2, RPS25, LOC101929876, RPS27, RPS29, SLC25A1, SRSF3, RPLP1, RPS18, RPS7, RPS9, RRP7A, NTRK1, AHSA1, HNRNPU, NPM1, KIF2C, CENPQ, EXOSC1, Rrbp1, MCM2, Ksr1, Mdm2, RC3H1, RPL26L1, RRS1, SLC9A1, CYLD, TRIM25, HEY1, BRCA1, YAP1, TRIM14, TMPO, PPIE, BMP4, CTNNB1, HDAC4, PCBP1, TGFB1, PYHIN1, PRPF8, EFTUD2, AAR2, PIH1D1, CHD3, CHD4, TNF, CDC34, FGF11, HEXIM1, MEPCE, LARP7, PPT1, SNAI1, AGR2, RECQL4, REST, MYC, RPS6KB2, GRWD1, METTL14, KIAA1429, EIF4B, PHB, NR2C2, PPP1CC, PPARG, VRK1, SNRNP70, ITFG1, BIRC3, NFX1, WWP2, TRIM28, CMTR1, CTTN, BACH2, RALY, USO1, SNRPF, PSTPIP1, SREK1IP1, CCDC64B, DRAP1, PPP1R27, TNFAIP8L1, STAC3, ARIH2, PLEKHA4, PINK1, FANCD2, HCVgp1, ORF50, ZC3H18, MAP3K14, EMC4, COL11A2, ANKRD55, E, M, nsp13, nsp14, nsp4, nsp5, nsp6, ORF3a, ORF6, ORF7a, ORF7b, ORF8, DUX4, CIT, ANLN, AURKB, CHMP4C, ECT2, KIF14, KIF20A, KIF23, PRC1, MKI67, LRRC59, INS, NDN, MAFB, BRD4, E7, Apc2, RBM39, LGALS9, RIN3, DNAJC2, DNAJC1, DNAJC25, OGT, PARK2, UFL1, DDRGK1, COIL, ATG3, FZR1, WDR5, NUDCD2, NAA40, DDX21, PNMAL1, RPL28, HIST1H1E, MAGEB2, SIRT1, PRKRA, NPM3, LIN28A, NEIL1, SPRTN, BTF3, FBXW7, SUPT5H, QKI, Srsf9, NLRP7, RCHY1, CCNF, N, SIRT6, |
Top |
|
| Clinically associated variants from ClinVar. |
| Gene | Chr | Position | RefSeq | VarSeq | RefSeeq | VarType | Pathogenic | Disease | VarInfo |
| RPL9 | chr4 | 39456392 | G | A | single_nucleotide_variant | Benign | not_provided | SO:0001627|intron_variant | SO:0001627|intron_variant |
| RPL9 | chr4 | 39456635 | T | C | single_nucleotide_variant | Benign | not_provided | SO:0001627|intron_variant | SO:0001627|intron_variant |
| RPL9 | chr4 | 39457857 | T | C | single_nucleotide_variant | Benign | not_provided | SO:0001627|intron_variant | SO:0001627|intron_variant |
| RPL9 | chr4 | 39457870 | T | TG | Insertion | Benign | not_provided | SO:0001627|intron_variant | SO:0001627|intron_variant |
| RPL9 | chr4 | 39458010 | G | C | single_nucleotide_variant | Benign | not_provided | SO:0001627|intron_variant | SO:0001627|intron_variant |
| RPL9 | chr4 | 39458042 | C | G | single_nucleotide_variant | Uncertain_significance | not_provided | SO:0001583|missense_variant | SO:0001583|missense_variant |
| RPL9 | chr4 | 39458051 | A | G | single_nucleotide_variant | Benign | not_provided | SO:0001819|synonymous_variant | SO:0001819|synonymous_variant |
| RPL9 | chr4 | 39459031 | T | C | single_nucleotide_variant | Benign | not_provided | SO:0001627|intron_variant | SO:0001627|intron_variant |
| RPL9 | chr4 | 39459154 | G | A | single_nucleotide_variant | Benign | not_provided | SO:0001627|intron_variant | SO:0001627|intron_variant |
| RPL9 | chr4 | 39459724 | T | C | single_nucleotide_variant | Benign | not_provided | SO:0001627|intron_variant | SO:0001627|intron_variant |
| RPL9 | chr4 | 39460204 | CCA | C | Deletion | Benign | not_provided | SO:0001623|5_prime_UTR_variant,SO:0001627|intron_variant | SO:0001623|5_prime_UTR_variant,SO:0001627|intron_variant |
| RPL9 | chr4 | 39460328 | G | A | single_nucleotide_variant | Benign | not_provided | SO:0001627|intron_variant | SO:0001627|intron_variant |
| RPL9 | chr4 | 39460352 | C | G | single_nucleotide_variant | Benign | not_provided | SO:0001627|intron_variant | SO:0001627|intron_variant |
| RPL9 | chr4 | 39460413 | C | A | single_nucleotide_variant | Likely_benign | not_provided | SO:0001627|intron_variant | SO:0001627|intron_variant |
| RPL9 | chr4 | 39460490 | C | G | single_nucleotide_variant | Benign | not_provided | SO:0001627|intron_variant | SO:0001627|intron_variant |
| RPL9 | chr4 | 39460508 | T | C | single_nucleotide_variant | Likely_benign | not_provided | SO:0001627|intron_variant | SO:0001627|intron_variant |
| nsSNVs with sample frequency (size of circle) from TCGA 33 cancers. |
 |
| SNVs and Indels |
| Gene | Cancer type | Chromosome | Start | End | RefSeeq | MutSeq | Mutation type | AAchange | # samples |
| RPL9 | SKCM | chr4 | 39458102 | 39458102 | G | A | Silent | p.I105I | 2 |
| RPL9 | UCEC | chr4 | 39459252 | 39459252 | C | T | Missense_Mutation | p.R71Q | 2 |
| RPL9 | LAML | chr4 | 39135654 | 39135654 | T | C | Missense_Mutation | p.T69A | 2 |
| RPL9 | SKCM | chr4 | 39456226 | 39456226 | G | A | Silent | p.I172I | 2 |
| RPL9 | STAD | chr4 | 39458038 | 39458038 | G | C | Missense_Mutation | p.R127G | 2 |
| RPL9 | STAD | chr4 | 39458044 | 39458044 | T | C | Missense_Mutation | p.R125G | 2 |
| RPL9 | STAD | chr4 | 39458157 | 39458157 | C | T | Missense_Mutation | p.G87D | 2 |
| RPL9 | THCA | chr4 | 39460022 | 39460022 | G | A | Missense_Mutation | p.P13L | 2 |
| RPL9 | SARC | chr4 | 39456508 | 39456508 | C | T | Missense_Mutation | 2 | |
| RPL9 | THCA | chr4 | 39460023 | 39460023 | G | A | Missense_Mutation | p.P13S | 2 |
| RPL9 | UCEC | chr4 | 39456527 | 39456527 | T | G | Missense_Mutation | p.E143D | 2 |
| RPL9 | KIRP | chr4 | 39456224 | 39456224 | C | A | Missense_Mutation | 2 | |
| RPL9 | BLCA | chr4 | 39456163 | 39456163 | T | G | Nonstop_Mutation | p.*193Y | 1 |
| RPL9 | LGG | chr4 | 39459817 | 39459817 | C | A | Missense_Mutation | 1 | |
| RPL9 | CESC | chr4 | 39460490 | 39460490 | C | G | Missense_Mutation | 1 | |
| RPL9 | LIHC | chr4 | 39459827 | 39459827 | T | C | Missense_Mutation | 1 | |
| RPL9 | CESC | chr4 | 39458080 | 39458080 | C | T | Missense_Mutation | 1 | |
| RPL9 | LIHC | chr4 | 39458043 | 39458043 | C | A | Missense_Mutation | p.R125M | 1 |
| RPL9 | STAD | chr4 | 39459818 | 39459818 | T | - | Frame_Shift_Del | p.K53fs | 1 |
| RPL9 | CESC | chr4 | 39458080 | 39458080 | C | T | Missense_Mutation | p.E113K | 1 |
| RPL9 | LIHC | chr4 | 39456189 | 39456190 | - | T | Frame_Shift_Ins | p.N185fs | 1 |
| RPL9 | COAD | chr4 | 39456557 | 39456557 | A | C | Silent | p.A133A | 1 |
| RPL9 | LIHC | chr4 | 39456503 | 39456503 | A | - | Frame_Shift_Del | p.I151fs | 1 |
| RPL9 | THCA | chr4 | 39460022 | 39460022 | G | A | Missense_Mutation | 1 | |
| RPL9 | COAD | chr4 | 39458096 | 39458096 | C | T | Silent | p.E107E | 1 |
| RPL9 | LUAD | chr4 | 39456152 | 39456152 | C | A | Splice_Site | 1 | |
| RPL9 | THCA | chr4 | 39460023 | 39460023 | G | A | Missense_Mutation | 1 | |
| RPL9 | COAD | chr4 | 39456504 | 39456504 | A | G | Missense_Mutation | p.I151T | 1 |
| RPL9 | LUAD | chr4 | 39458036 | 39458036 | C | A | Silent | p.R127R | 1 |
| RPL9 | KIRP | chr4 | 39458152 | 39458152 | G | T | Missense_Mutation | 1 | |
| RPL9 | KIRP | chr4 | 39458117 | 39458117 | G | T | Silent | 1 | |
| RPL9 | SARC | chr4 | 39456508 | 39456508 | C | T | Missense_Mutation | p.D150N | 1 |
| Copy number variation (CNV) of RPL9 * Click on the image to open the original image in a new window. |
 |
| Fusion gene breakpoints (product of the structural variants (SVs)) across RPL9 * Click on the image to open the UCSC genome browser with custom track showing this image in a new window. |
 |
| Fusion genes with this translation factor from FusionGDB2.0. |
| FusionGDB2 ID | Disease | Sample | Hgene | Hchr | Hbp | Hstrand | Tgene | Tchr | Tbp | Tstrand |
| 65897 | READ | TCGA-G5-6233 | ANKRD17 | chr4 | 74123992 | - | RPL9 | chr4 | 39458158 | - |
| 65897 | N/A | BF814523 | CNDP2 | chr18 | 72163620 | - | RPL9 | chr4 | 39456258 | - |
| 65897 | STAD | TCGA-F1-A72C | MACF1 | chr1 | 39926466 | + | RPL9 | chr4 | 39458158 | - |
| 65898 | BRCA | TCGA-E9-A5FK | PLAC8 | chr4 | 84035818 | - | RPL9 | chr4 | 39458158 | - |
| 101139 | N/A | AA642625 | RPL9 | chr4 | 39458159 | + | APOO | chrX | 23854761 | + |
| 103019 | N/A | AI535832 | RPL9 | chr4 | 39455750 | - | SIPA1L3 | chr19 | 38482980 | + |
| 77074 | N/A | AA552739 | RPL9 | chr4 | 39458159 | + | UBE2Q2P2 | chr15 | 83041047 | + |
| 77074 | N/A | BG575899 | RPL9 | chr4 | 39455757 | - | UBE2Q2P2 | chr15 | 83041016 | - |
| 77074 | N/A | BI860673 | RPL9 | chr4 | 39455757 | - | UBE2Q2P2 | chr15 | 83041426 | - |
| 77074 | N/A | EC451584 | RPL9 | chr4 | 39455847 | + | UBE2Q2P2 | chr15 | 83040960 | + |
| 96616 | READ | TCGA-AG-A00C | RPL9 | chr4 | 39458057 | - | UFM1 | chr13 | 38935764 | + |
| 77074 | HNSC | TCGA-BA-A8YP | RPL9 | chr4 | 39459206 | - | UGDH | chr4 | 39515804 | - |
| 98040 | N/A | CF124687 | RPL9 | chr4 | 39455744 | - | URI1 | chr19 | 30447578 | - |
Top |
|
| Kaplan-Meier plots with logrank tests of overall survival (OS) |
| Cancer type | Translation factor | Coefficent | Hazard ratio | Wald test pval | Likelihool ratio pval | Logrank test pval | # samples |
Top |
|
| Differential gene expression between female and male. (Wilcoxon test, pval<0.05) |
| Cancer type | Translation factor | pval | adj.p |
Top |
|
| Differential gene expression between young and old age groups (Wilcoxon test, pval<0.05) |
| Cancer type | Translation factor | pval | adj.p |
Top |
|
| Drugs targeting genes involved in this translation factor. (DrugBank Version 5.1.8 2021-05-08) |
| UniProtAcc | DrugBank ID | Drug name | Drug activity | Drug type | Drug status |
Top |
|
| Diseases associated with this translation factor. (DisGeNet 4.0) |
| Disease ID | Disease Name | # PubMeds | Disease source |
| C1260899 | Anemia, Diamond-Blackfan | 2 | GENOMICS_ENGLAND |
(UTHealth)
Web File Viewing | Emergency Information |Campus Carry|Site Policies