
|
||||||
|

Translation Factor: MRPL9 (NCBI Gene ID:65005) |
|
 Gene Summary Gene Summary |
| Gene Information | Gene Name: MRPL9 | Gene ID: 65005 | Gene Symbol | MRPL9 | Gene ID | 65005 |
| Gene Name | mitochondrial ribosomal protein L9 | |
| Synonyms | L9mt | |
| Cytomap | 1q21.3 | |
| Type of Gene | protein-coding | |
| Description | 39S ribosomal protein L9, mitochondrialmitochondrial large ribosomal subunit protein bL9m | |
| Modification date | 20200313 | |
| UniProtAcc | Q9BYD2 | |
| Child GO biological process term(s) under GO:0006412 |
| GO ID | GO term |
| GO:0005840 | Ribosome |
| GO:0006412 | Translation |
| Gene ontology of translaction factor with evidence of Inferred from Direct Assay (IDA) from Entrez |
| Partner | Gene | GO ID | GO term | PubMed ID |
| Inferred gene age of translation factor. |
| Gene | Inferred gene age group among (0 - 67.6], (67.6 - 355.7], (355.7 - 733], (733 - 1119.25], >1119.25 |
| MRPL9 | >1119.25 |
Top |
|
| We searched PubMed using 'MRPL9[title] AND translation [title] AND human.' |
| Gene | Title | PMID |
| MRPL9 | . | . |
Top |
|
| Skipped exons in TCGA and GTEx based on Ensembl gene isoform structure. * Click on the image to open the UCSC genome browser with custom track showing this image in a new window. For more annotations, please visit our ExonSkipDB. |
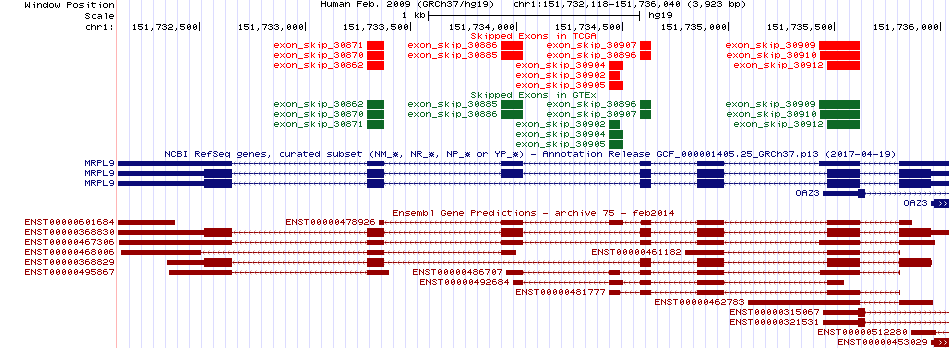 |
| Open reading frame (ORF) analsis of exon skipping events based on Ensembl gene isoform structure. * Click on the break point to see the gene structure around the break point region using the UCSC Genome Browser. |
| ENST | Exon skip start (DNA) | Exon Skip end (DNA) | ORF |
| ENST00000368830 | 151733291 | 151733375 | In-frame |
| ENST00000368830 | 151733926 | 151734028 | In-frame |
| ENST00000368830 | 151734580 | 151734631 | In-frame |
| Exon skipping position in the amino acid sequence. |
| ENST | Exon skip start (DNA) | Exon Skip end (DNA) | Len(transcript seq) | Exon skip start (mRNA) | Exon Skip end (mRNA) | Len(amino acid seq) | Exon skip start (AA) | Exon Skip end (AA) |
| ENST00000368830 | 151733291 | 151733375 | 1313 | 674 | 757 | 267 | 196 | 224 |
| ENST00000368830 | 151733926 | 151734028 | 1313 | 572 | 673 | 267 | 162 | 196 |
| ENST00000368830 | 151734580 | 151734631 | 1313 | 521 | 571 | 267 | 145 | 162 |
| Potentially (partially) lost protein functional features of UniProt. |
| UniProtAcc | Exon skip start (AA) | Exon Skip end (AA) | Function feature start (AA) | Function feature end (AA) | Functional feature type | Functional feature desc. |
| Q9BYD2 | 145 | 162 | 53 | 267 | Chain | ID=PRO_0000030550;Note=39S ribosomal protein L9%2C mitochondrial |
| Q9BYD2 | 196 | 224 | 53 | 267 | Chain | ID=PRO_0000030550;Note=39S ribosomal protein L9%2C mitochondrial |
| Q9BYD2 | 162 | 196 | 53 | 267 | Chain | ID=PRO_0000030550;Note=39S ribosomal protein L9%2C mitochondrial |
| Q9BYD2 | 196 | 224 | 210 | 210 | Natural variant | ID=VAR_028137;Note=E->A;Ontology_term=ECO:0000269;evidence=ECO:0000269|PubMed:11279069;Dbxref=dbSNP:rs8480,PMID:11279069 |
Top |
|
| Gene expression level across TCGA pancancer |
 |
| Gene expression level across GTEx pantissue |
 |
| Expression level of gene isoforms across TCGA pancancer |
 |
| Expression level of gene isoforms across GTEx pantissue |
 |
| Cancer(tissue) type-specific expression level of Translation factor using z-score distriution |
 |
| Differential expression between tumor and matched normal (in the cancer types with more than 10 matched samples) |
 |
| Cancer type | Translation factor | FC | adj.pval |
| KICH | MRPL9 | 1.16888038960038 | 0.000120222568511963 |
| STAD | MRPL9 | -1.54523483458273 | 0.0118026207201183 |
Top |
|
| Translation factor expression regulation through miRNA binding |
| Cancer type | Gene | miRNA | TargetScan binding score (Context++ score percentile) | Coefficient | Pvalue |
| Translation factor expression regulation through methylation in the promoter of Translation factor |
 |
| Cancer type | Gene | methyl group b | methyl group a | DEG pval | avg methyl in b | avg methyl in a | avg exp in b | avg exp in a |
| Translation factor expression regulation through methylation in the gene body of Translation factor (positive regulation) |
 |
| Cancer type | Gene | methyl group b | methyl group a | DEG pval | avg methyl in b | avg methyl in a | avg exp in b | avg exp in a |
| Translation factor expression regulation through copy number variation of Translation factor |
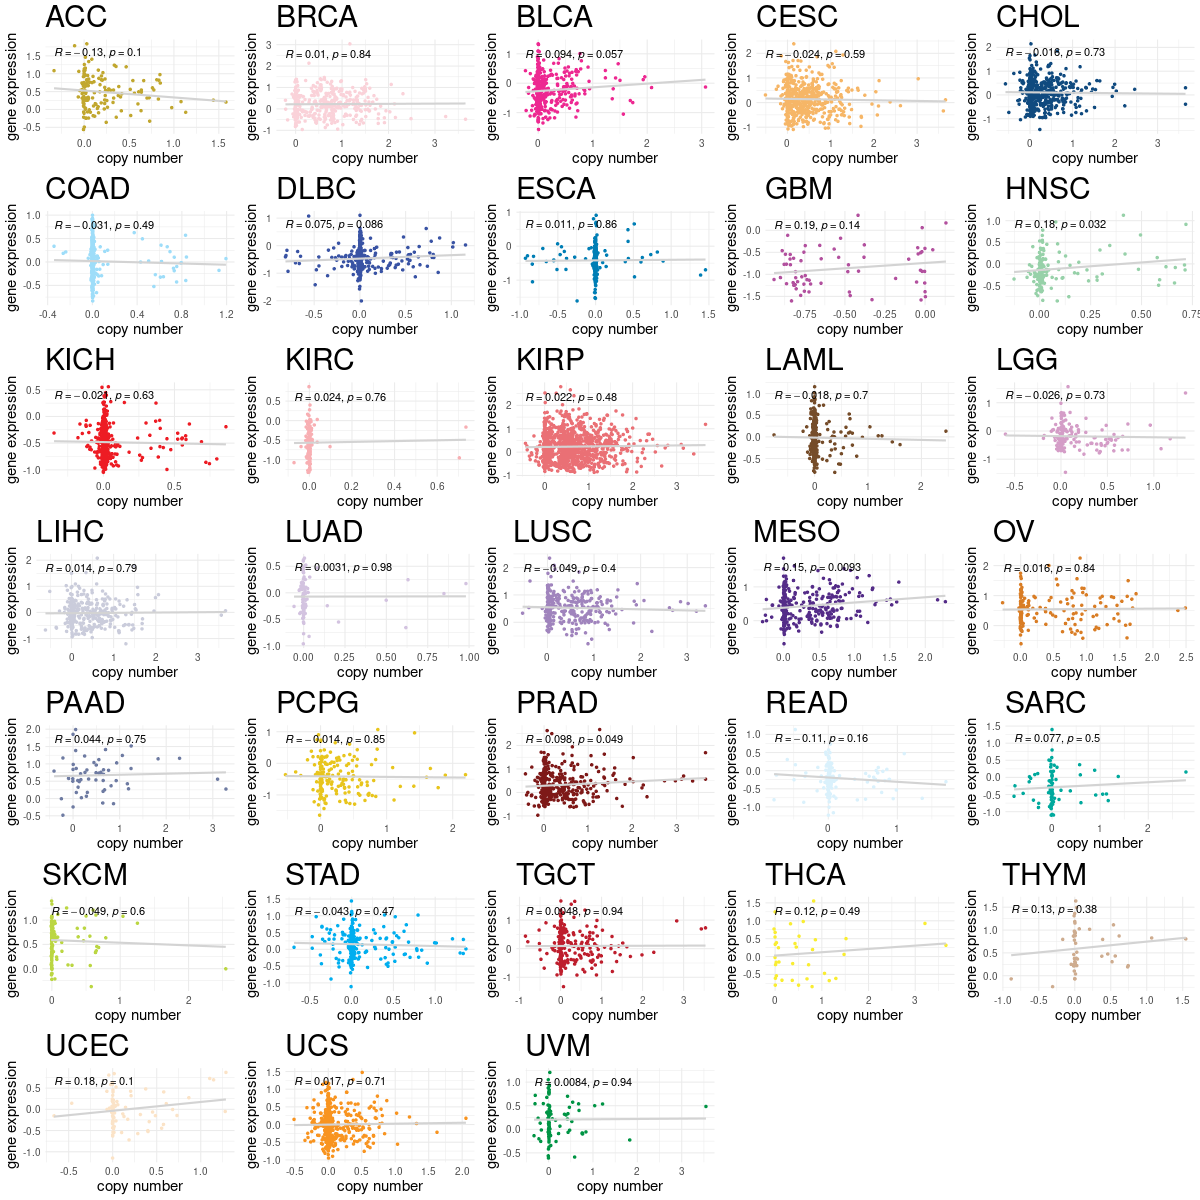 |
| Cancer type | Gene | Coefficient | Pvalue |
| MESO | MRPL9 | 0.150393224 | 0.009322867 |
| HNSC | MRPL9 | 0.088307859 | 0.03172172 |
| PRAD | MRPL9 | 0.10739752 | 0.049178809 |
Top |
|
| Strongly correlated genes belong to cellular important gene groups with MRPL9 (coefficient>0.8, pval<0.05, node color based on FC between tumor and matched normal). Significantly associated important genes in the individual cancer types. * Cell metabolism gene: cell metabolism genes from REACTOME (black edge), IUPHAR: drug target genes from IUPHAR (blue edge), Kinase: human kinase genes (brown edge), CGC: cancer gene census genes (orange edge), TSG: tumor suppresor genes (purple edge), Epifactor: epigenetic factors (light blue edge), TF: transcription factors (green) |
 |
| Cancer type | Gene group | Translation factor | Correlated gene | Coefficient | Pvalue |
| ACC | Cell metabolism gene | MRPL9 | PSMD4 | 0.816882162 | 4.38E-20 |
| ACC | Epifactor | MRPL9 | VPS72 | 0.837283527 | 6.97E-22 |
| BLCA | Cell metabolism gene | MRPL9 | PSMB4 | 0.81147398 | 5.75E-101 |
| BRCA | Cell metabolism gene | MRPL9 | PSMB4 | 0.824702737 | 2.90E-303 |
| BRCA | Epifactor | MRPL9 | VPS72 | 0.869249257 | 0 |
| CHOL | Cell metabolism gene | MRPL9 | POLR3C | 0.800275282 | 4.20E-11 |
| CHOL | Cell metabolism gene | MRPL9 | PPOX | 0.810780924 | 1.47E-11 |
| CHOL | Cell metabolism gene | MRPL9 | FLAD1 | 0.815041593 | 9.44E-12 |
| CHOL | Cell metabolism gene | MRPL9 | PI4KB | 0.818168854 | 6.76E-12 |
| CHOL | Cell metabolism gene | MRPL9 | PSMD4 | 0.82001047 | 5.54E-12 |
| CHOL | Cell metabolism gene | MRPL9 | SSR2 | 0.864674936 | 1.93E-14 |
| CHOL | Cell metabolism gene | MRPL9 | SNRPE | 0.868785569 | 1.04E-14 |
| CHOL | Cell metabolism gene | MRPL9 | B4GALT3 | 0.893049588 | 1.64E-16 |
| CHOL | CGC | MRPL9 | SETDB1 | 0.8545304 | 8.21E-14 |
| CHOL | CGC | MRPL9 | PRCC | 0.895455784 | 1.03E-16 |
| CHOL | Epifactor | MRPL9 | SETDB1 | 0.8545304 | 8.21E-14 |
| CHOL | Epifactor | MRPL9 | USP21 | 0.882970451 | 1.03E-15 |
| CHOL | Epifactor | MRPL9 | VPS72 | 0.932295888 | 1.32E-20 |
| CHOL | IUPHAR | MRPL9 | PI4KB | 0.818168854 | 6.76E-12 |
| CHOL | IUPHAR | MRPL9 | CLK2 | 0.851979455 | 1.16E-13 |
| CHOL | IUPHAR | MRPL9 | SETDB1 | 0.8545304 | 8.21E-14 |
| CHOL | Kinase | MRPL9 | CLK2 | 0.851979455 | 1.16E-13 |
| CHOL | TF | MRPL9 | ZNF692 | 0.829850374 | 1.84E-12 |
| CHOL | TF | MRPL9 | USF1 | 0.830410612 | 1.72E-12 |
| CHOL | TF | MRPL9 | SETDB1 | 0.8545304 | 8.21E-14 |
| CHOL | TSG | MRPL9 | GAS5 | 0.832126538 | 1.41E-12 |
| COAD | Cell metabolism gene | MRPL9 | CCT3 | 0.814919586 | 1.86E-79 |
| COAD | Cell metabolism gene | MRPL9 | SNRPE | 0.848264896 | 2.75E-92 |
| COAD | Epifactor | MRPL9 | VPS72 | 0.848705584 | 1.77E-92 |
| DLBC | Cell metabolism gene | MRPL9 | SNRPE | 0.805524595 | 5.05E-12 |
| DLBC | CGC | MRPL9 | PRCC | 0.850990229 | 1.86E-14 |
| DLBC | Epifactor | MRPL9 | VPS72 | 0.832178058 | 2.31E-13 |
| KICH | Cell metabolism gene | MRPL9 | TBCE | 0.802448267 | 1.16E-21 |
| KICH | Cell metabolism gene | MRPL9 | PPOX | 0.804570367 | 7.51E-22 |
| KICH | Cell metabolism gene | MRPL9 | LSM2 | 0.81119494 | 1.89E-22 |
| KICH | Cell metabolism gene | MRPL9 | EXOSC1 | 0.818665198 | 3.73E-23 |
| KICH | Cell metabolism gene | MRPL9 | NUDT5 | 0.837777717 | 4.09E-25 |
| KICH | Cell metabolism gene | MRPL9 | PSMD4 | 0.895192675 | 5.44E-33 |
| KICH | Epifactor | MRPL9 | DPY30 | 0.817498917 | 4.83E-23 |
| KICH | Epifactor | MRPL9 | EXOSC1 | 0.818665198 | 3.73E-23 |
| KIRP | Cell metabolism gene | MRPL9 | SNRPE | 0.839913108 | 3.33E-87 |
| LIHC | Epifactor | MRPL9 | VPS72 | 0.856785749 | 3.68E-123 |
| LUAD | Cell metabolism gene | MRPL9 | FLAD1 | 0.819935229 | 3.57E-141 |
| LUAD | Cell metabolism gene | MRPL9 | PSMD4 | 0.845804782 | 9.26E-159 |
| LUAD | Cell metabolism gene | MRPL9 | PSMB4 | 0.846870151 | 1.49E-159 |
| LUAD | Epifactor | MRPL9 | VPS72 | 0.856198949 | 9.17E-167 |
| LUSC | Cell metabolism gene | MRPL9 | PSMD4 | 0.854681436 | 5.33E-159 |
| LUSC | Cell metabolism gene | MRPL9 | PSMB4 | 0.861390846 | 3.16E-164 |
| LUSC | Epifactor | MRPL9 | VPS72 | 0.846336637 | 7.45E-153 |
| OV | Epifactor | MRPL9 | VPS72 | 0.834550711 | 3.25E-81 |
| PAAD | Cell metabolism gene | MRPL9 | CCT3 | 0.804294131 | 8.95E-43 |
| PAAD | Cell metabolism gene | MRPL9 | PFDN2 | 0.810743034 | 5.91E-44 |
| PAAD | Cell metabolism gene | MRPL9 | PSMB4 | 0.817074947 | 3.70E-45 |
| PAAD | Cell metabolism gene | MRPL9 | FLAD1 | 0.841658069 | 2.58E-50 |
| PAAD | Cell metabolism gene | MRPL9 | PSMD4 | 0.884335123 | 8.85E-62 |
| PAAD | Epifactor | MRPL9 | VPS72 | 0.85271814 | 6.24E-53 |
| PCPG | Epifactor | MRPL9 | VPS72 | 0.849888048 | 2.33E-53 |
| PRAD | Cell metabolism gene | MRPL9 | PSMB4 | 0.801921046 | 1.08E-124 |
| READ | Cell metabolism gene | MRPL9 | FLAD1 | 0.800626274 | 1.19E-24 |
| READ | Cell metabolism gene | MRPL9 | PSMB4 | 0.801013059 | 1.09E-24 |
| READ | Epifactor | MRPL9 | VPS72 | 0.804980022 | 4.30E-25 |
| STAD | Cell metabolism gene | MRPL9 | PSMB4 | 0.806300097 | 3.21E-104 |
| STAD | Epifactor | MRPL9 | VPS72 | 0.830670998 | 5.21E-116 |
| TGCT | Cell metabolism gene | MRPL9 | MTX1 | 0.801625531 | 3.12E-36 |
| TGCT | Cell metabolism gene | MRPL9 | PSMD4 | 0.887331213 | 1.22E-53 |
| TGCT | Cell metabolism gene | MRPL9 | PSMB4 | 0.897337094 | 1.41E-56 |
| THYM | Cell metabolism gene | MRPL9 | PSMD4 | 0.814086085 | 4.24E-30 |
| THYM | Cell metabolism gene | MRPL9 | PSMB4 | 0.830691414 | 2.62E-32 |
| THYM | Cell metabolism gene | MRPL9 | SNRPE | 0.835884877 | 4.76E-33 |
| THYM | Epifactor | MRPL9 | VPS72 | 0.806237068 | 3.94E-29 |
| UCEC | Epifactor | MRPL9 | VPS72 | 0.81310512 | 1.20E-48 |
| UCS | Cell metabolism gene | MRPL9 | PSMD4 | 0.814086085 | 4.24E-30 |
| UCS | Cell metabolism gene | MRPL9 | PSMB4 | 0.830691414 | 2.62E-32 |
| UCS | Cell metabolism gene | MRPL9 | SNRPE | 0.835884877 | 4.76E-33 |
| UCS | Epifactor | MRPL9 | VPS72 | 0.806237068 | 3.94E-29 |
Top |
|
| Protein 3D structure Visit iCn3D. |
Top |
|
| Protein-protein interaction networks * Overlap between up-regulated DEGs (log2FC<-1 and adj.P<0.05) and STRING PPI network (center: Translation factor, node: DEGs, edges: weighted by -log2(adj.P)) |
 |
| Overlap between down-regulated DEGs (log2FC>1 and adj.P<0.05) and STRING PPI network (center: Translation factor, node: DEGs, edges: weighted by -log2(adj.P)) |
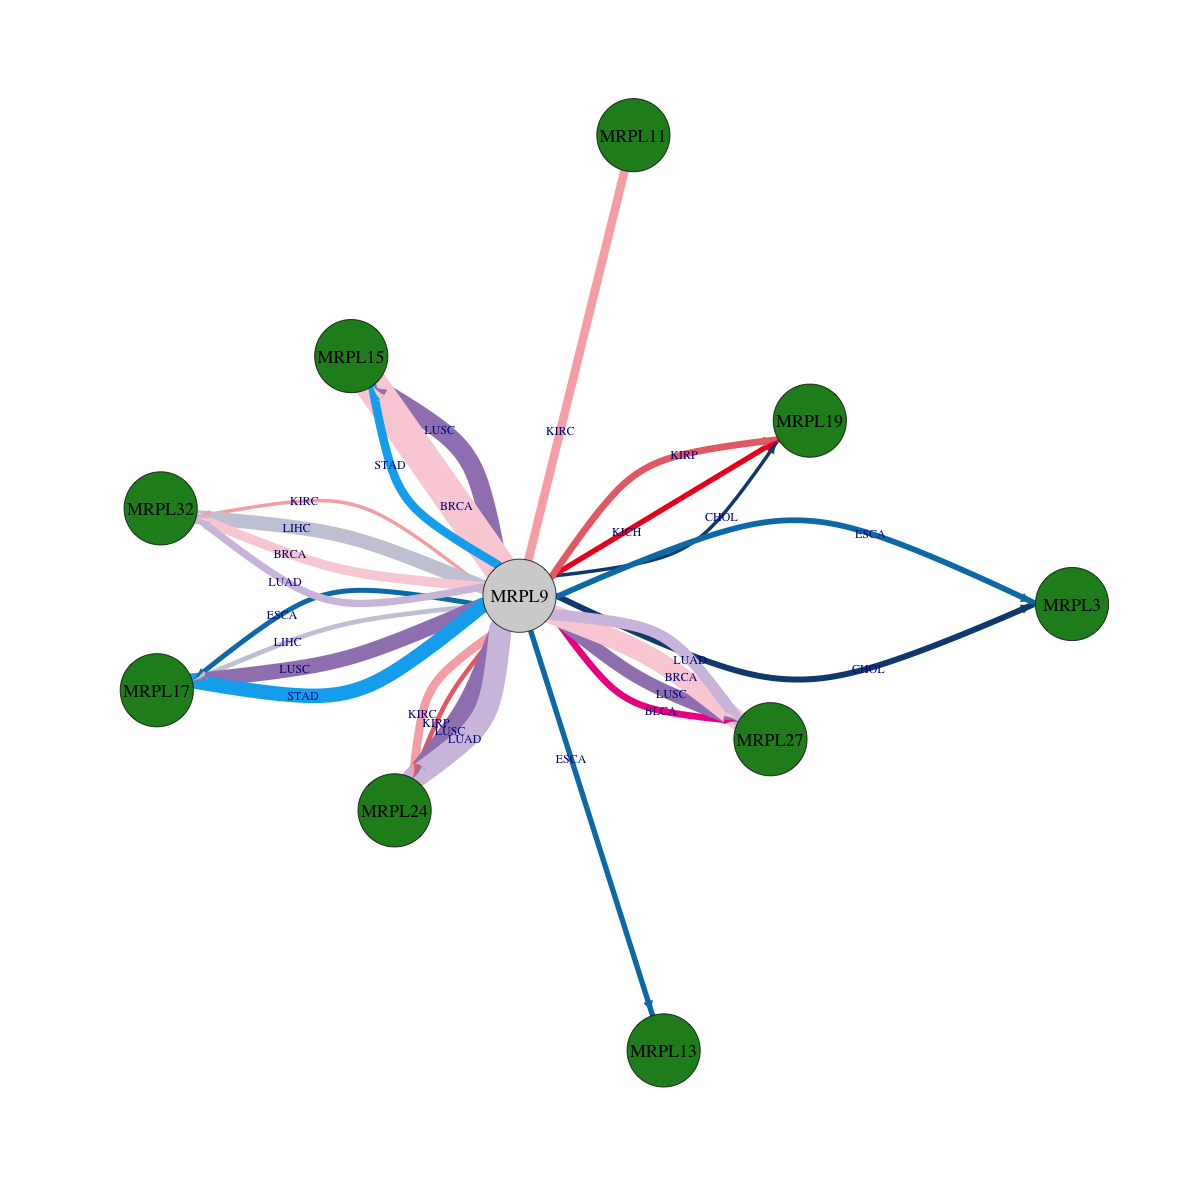 |
 * Edge colors based on TCGA cancer types. |
| * Overlap between DEGs (log2FC>1 and adj.P<0.05) and STRING PPI network per cancer (center: Translation factor, node: DEGs, node color: log2FC, edges: weighted by -log2(adj.P)) |
 |
| Cancer type | Translation factor | Interacting protein coding gene | FC | adj.pval |
| BRCA | MRPL9 | MRPL32 | -3.7979134181794 | 0.000134327661287861 |
| STAD | MRPL9 | MRPL15 | -2.15546608137429 | 0.000334546435624361 |
| KIRC | MRPL9 | MRPL11 | -1.04966837625557 | 0.000354478033746394 |
| KIRC | MRPL9 | MRPL24 | -1.34802117098363 | 0.000369980864421695 |
| LIHC | MRPL9 | MRPL13 | 1.54402472107614 | 0.000655351190157038 |
| LUAD | MRPL9 | MRPL32 | -2.1966239418264 | 0.00121089428940613 |
| KIRP | MRPL9 | MRPL19 | -1.9689242575519 | 0.00179363833740354 |
| BLCA | MRPL9 | MRPL27 | -4.19270554058168 | 0.00202178955078125 |
| KICH | MRPL9 | MRPL24 | 1.42000841970622 | 0.00378090143203735 |
| CHOL | MRPL9 | MRPL3 | -2.68429255990621 | 0.00390625 |
| ESCA | MRPL9 | MRPL3 | -4.97897094908275 | 0.0048828125 |
| COAD | MRPL9 | MRPL15 | 1.17181689924568 | 0.00513318181037904 |
| KICH | MRPL9 | MRPL19 | -2.18550705564541 | 0.00672554969787598 |
| ESCA | MRPL9 | MRPL13 | -1.07746088474995 | 0.0068359375 |
| ESCA | MRPL9 | MRPL17 | -1.18756178214998 | 0.009765625 |
| LIHC | MRPL9 | MRPL17 | -1.06225729770915 | 0.0124123499319886 |
| KIRP | MRPL9 | MRPL24 | -2.9092481117556 | 0.0139979305677116 |
| STAD | MRPL9 | MRPL4 | 1.4393539135682 | 0.0279771662317216 |
| KIRC | MRPL9 | MRPL32 | -2.79664327578899 | 0.0376051795400881 |
| CHOL | MRPL9 | MRPL19 | -2.09295650388558 | 0.0390625 |
| LUAD | MRPL9 | MRPL24 | -3.53731160751159 | 1.10656371043093e-09 |
| PRAD | MRPL9 | MRPL11 | 1.12581653394628 | 1.15996224044503e-05 |
| BRCA | MRPL9 | MRPL27 | -1.5584165725499 | 1.16393956539382e-08 |
| KICH | MRPL9 | MRPL15 | 1.54522142310359 | 1.19209289550781e-07 |
| STAD | MRPL9 | MRPL17 | -3.90880705449186 | 1.49570405483246e-06 |
| LUSC | MRPL9 | MRPL15 | -4.43702988385305 | 1.91594862886626e-08 |
| KIRC | MRPL9 | MRPL3 | 1.69955762234244 | 1.97132191719422e-08 |
| LIHC | MRPL9 | MRPL32 | -1.20074144698753 | 2.24402029682138e-06 |
| LIHC | MRPL9 | MRPL24 | 1.01230339617377 | 2.71217975233539e-06 |
| COAD | MRPL9 | MRPL4 | 2.77705897514473 | 2.98023223876954e-07 |
| LUAD | MRPL9 | MRPL27 | -1.39404329671842 | 3.44055922076328e-05 |
| LUSC | MRPL9 | MRPL27 | -1.81809468729316 | 3.90393047420304e-06 |
| BRCA | MRPL9 | MRPL15 | -3.82448964360727 | 5.49451113259074e-14 |
| LUSC | MRPL9 | MRPL17 | -6.83409683292749 | 6.93230040561614e-07 |
| LUSC | MRPL9 | MRPL24 | -2.80841690659614 | 7.95689711347621e-09 |
| Protein-protein interactors with this translation factor (BIOGRID-3.4.160) |
| PPI interactors with MRPL9 |
| ICT1, CAND1, MRPL15, MRPL37, MRPL3, MRPL44, MRPL39, MRPL38, MRPL19, MRPL2, MRPL45, MRPL40, MRPL55, MRPL11, MRPL13, MRPL32, MRPL23, MRPL12, MRPL28, TMEM177, ILF3, DDX28, SLC25A3, PLP2, EIF4H, SAT1, SOX2, FAM9B, EGFR, RPL13, ZNF22, RBMS3, RPL6, ZC3H3, RPS8, MRPL4, HNRNPA1, MRPS30, MRPL47, GAA, MRPL17, MRPL18, MRPL46, MRPL48, DLD, GANAB, MRPL24, NSF, SCFD1, PLBD2, MRPL49, SLC25A10, EIF4G1, JUP, TK2, MRPL33, MRPL42, MRPL22, ITSN2, MRPL51, MRPL30, MRPL27, MRPL35, MRPL50, MRPL16, MRPL20, MRPS18A, NLN, MRPL14, MRPL41, MRPL34, MRPL1, THAP9, MRPL43, MICALL1, GADD45GIP1, MRPL53, MRPL54, MRPL52, MRPL10, TMEM92, MRPL21, NANOG, POU5F1, C6orf203, MEPCE, LARP7, UBE3A, RECQL4, SERBP1, MRM1, HSPD1, TRMT61B, AURKAIP1, ALYREF, SNRNP70, TRIM28, CDC37, HNRNPK, PLEKHA4, ESR1, ZC3HAV1, ACAD9, AUH, C12orf65, C1QBP, C21orf33, CHCHD1, CS, FASTKD2, FASTKD3, FASTKD5, GFM1, GFM2, HINT2, LRPPRC, CCDC109B, MDH2, METTL15, METTL17, MRPS12, MRPS26, MRRF, MTERF3, MTG1, MTG2, MTIF2, MTIF3, MTRF1, MTRF1L, NGRN, PMPCA, PMPCB, RPUSD3, RPUSD4, SLIRP, SSBP1, TACO1, TBRG4, TMEM70, TRUB2, TSFM, TUFM, VWA8, EXD2, Apc2, DNAJC15, HSCB, DCAF13, CIAO1, FAM76B, EZH2, HTRA4, RPL35, RPL13A, H2AFB3, RPL37, RPL19, RBMS2, SRSF3, HIST1H1E, LIN28A, RPL26, RPL18, KRR1, ABT1, MALSU1, APOBEC3C, GNL3, GLI4, RPL27A, THAP3, HNRNPU, RPL17, YBX2, MRPS17, FAU, IGF2BP3, H1FNT, SRSF4, MSI1, YBX1, PRR3, ZNF485, SRSF5, RPL10, MRPS25, HIST1H1T, APOBEC3D, RPS6, NEIL1, HIST1H1A, FAHD1, RPL23A, HIST1H2AM, SRSF7, |
Top |
|
| Clinically associated variants from ClinVar. |
| Gene | Chr | Position | RefSeq | VarSeq | RefSeeq | VarType | Pathogenic | Disease | VarInfo |
| MRPL9 | chr1 | 151733379 | C | CAA | Duplication | Benign | not_specified | SO:0001627|intron_variant | SO:0001627|intron_variant |
| MRPL9 | chr1 | 151734985 | T | C | single_nucleotide_variant | Benign | not_provided | SO:0001627|intron_variant | SO:0001627|intron_variant |
| nsSNVs with sample frequency (size of circle) from TCGA 33 cancers. |
 |
| SNVs and Indels |
| Gene | Cancer type | Chromosome | Start | End | RefSeeq | MutSeq | Mutation type | AAchange | # samples |
| MRPL9 | CESC | chr1 | 151735576 | 151735576 | T | C | Missense_Mutation | 3 | |
| MRPL9 | SKCM | chr1 | 151734888 | 151734888 | G | A | Silent | p.S133S | 3 |
| MRPL9 | UCEC | chr1 | 151734931 | 151734931 | C | T | Missense_Mutation | p.G119D | 3 |
| MRPL9 | HNSC | chr1 | 151735515 | 151735515 | C | T | Silent | p.K87K | 2 |
| MRPL9 | SKCM | chr1 | 151733936 | 151733936 | G | A | Silent | p.F193F | 2 |
| MRPL9 | HNSC | chr1 | 151732598 | 151732598 | C | A | Missense_Mutation | p.K244N | 2 |
| MRPL9 | UCEC | chr1 | 151732590 | 151732590 | C | A | Missense_Mutation | p.R247I | 2 |
| MRPL9 | BRCA | chr1 | 151734858 | 151734858 | C | A | Missense_Mutation | p.E143D | 2 |
| MRPL9 | SKCM | chr1 | 151734008 | 151734008 | G | A | Silent | p.S169S | 2 |
| MRPL9 | HNSC | chr1 | 151732587 | 151732587 | T | C | Missense_Mutation | p.Y248C | 2 |
| MRPL9 | UCEC | chr1 | 151733313 | 151733313 | G | A | Silent | p.G217 | 2 |
| MRPL9 | BRCA | chr1 | 151735549 | 151735549 | C | T | Missense_Mutation | p.R76Q | 2 |
| MRPL9 | SKCM | chr1 | 151733957 | 151733957 | A | T | Silent | p.P186P | 2 |
| MRPL9 | UCEC | chr1 | 151734876 | 151734876 | C | A | Missense_Mutation | p.K137N | 2 |
| MRPL9 | SKCM | chr1 | 151733958 | 151733958 | G | A | Missense_Mutation | p.P186L | 2 |
| MRPL9 | KIRP | chr1 | 151735832 | 151735832 | C | T | Missense_Mutation | p.A42T | 2 |
| MRPL9 | STAD | chr1 | 151733319 | 151733319 | C | T | Silent | p.R215R | 2 |
| MRPL9 | STAD | chr1 | 151732634 | 151732634 | T | A | Missense_Mutation | p.R232S | 2 |
| MRPL9 | HNSC | chr1 | 151734860 | 151734860 | C | A | Nonsense_Mutation | p.E143* | 2 |
| MRPL9 | CESC | chr1 | 151735518 | 151735518 | C | A | Silent | p.T86 | 1 |
| MRPL9 | SARC | chr1 | 151735297 | 151735297 | G | A | RNA | NULL | 1 |
| MRPL9 | UCEC | chr1 | 151735576 | 151735576 | T | - | Frame_Shift_Del | p.E67fs | 1 |
| MRPL9 | BLCA | chr1 | 151733963 | 151733963 | C | T | Silent | p.L184L | 1 |
| MRPL9 | LIHC | chr1 | 151732544 | 151732544 | G | - | Frame_Shift_Del | p.P262fs | 1 |
| MRPL9 | COAD | chr1 | 151732618 | 151732618 | C | T | Missense_Mutation | p.V238M | 1 |
| MRPL9 | LIHC | chr1 | 151732601 | 151732601 | G | - | Frame_Shift_Del | p.P243fs | 1 |
| MRPL9 | COAD | chr1 | 151732620 | 151732620 | A | G | Missense_Mutation | p.V237A | 1 |
| MRPL9 | LIHC | chr1 | 151735885 | 151735885 | C | - | Frame_Shift_Del | p.G25fs | 1 |
| MRPL9 | COAD | chr1 | 151733327 | 151733327 | T | C | Missense_Mutation | p.I213V | 1 |
| MRPL9 | KIRC | chr1 | 151732588 | 151732588 | A | T | Missense_Mutation | p.Y248N | 1 |
| MRPL9 | CESC | chr1 | 151733335 | 151733335 | T | G | Missense_Mutation | 1 | |
| MRPL9 | LUAD | chr1 | 151732528 | 151732528 | A | T | Nonstop_Mutation | p.*268K | 1 |
| MRPL9 | DLBC | chr1 | 151735913 | 151735913 | G | A | Missense_Mutation | p.R15W | 1 |
| MRPL9 | KIRC | chr1 | 151735551 | 151735551 | C | T | Silent | p.R75R | 1 |
| MRPL9 | LUAD | chr1 | 151732565 | 151732565 | T | - | Frame_Shift_Del | p.Q255fs | 1 |
| MRPL9 | ESCA | chr1 | 151734490 | 151734490 | C | T | RNA | NULL | 1 |
| MRPL9 | CESC | chr1 | 151735518 | 151735518 | C | A | Silent | 1 | |
| MRPL9 | LUSC | chr1 | 151732535 | 151732535 | G | C | Silent | p.P265P | 1 |
| MRPL9 | ESCA | chr1 | 151735572 | 151735573 | - | C | Frame_Shift_Ins | p.R69fs | 1 |
| MRPL9 | KIRP | chr1 | 151735603 | 151735616 | CGCTCCACGATGAC | - | Frame_Shift_Del | p.VIVER54fs | 1 |
| MRPL9 | CESC | chr1 | 151734851 | 151734851 | C | T | Splice_Site | 1 | |
| MRPL9 | LUSC | chr1 | 151732617 | 151732617 | A | - | Frame_Shift_Del | p.V238fs | 1 |
| MRPL9 | HNSC | chr1 | 151732598 | 151732598 | C | A | Missense_Mutation | 1 | |
| MRPL9 | KIRP | chr1 | 151735603 | 151735616 | CGCTCCACGATGAC | - | Frame_Shift_Del | p.54_58del | 1 |
| MRPL9 | CESC | chr1 | 151733963 | 151733963 | C | T | Silent | 1 | |
| MRPL9 | OV | chr1 | 150000577 | 150000577 | T | C | Missense_Mutation | 1 | |
| MRPL9 | HNSC | chr1 | 151732587 | 151732587 | T | C | Missense_Mutation | 1 | |
| MRPL9 | UCEC | chr1 | 151733292 | 151733292 | C | T | Silent | p.T224_splice | 1 |
| MRPL9 | KIRP | chr1 | 151735603 | 151735616 | CGCTCCACGATGAC | - | Frame_Shift_Del | p.V54fs | 1 |
| MRPL9 | CESC | chr1 | 151734851 | 151734851 | C | T | Splice_Site | e3+1 | 1 |
| MRPL9 | SARC | chr1 | 151732538 | 151732538 | G | T | Missense_Mutation | 1 | |
| MRPL9 | HNSC | chr1 | 151735515 | 151735515 | C | T | Silent | 1 | |
| MRPL9 | BLCA | chr1 | 151733936 | 151733936 | G | T | Missense_Mutation | 1 | |
| MRPL9 | LIHC | chr1 | 151734954 | 151734954 | C | T | Silent | 1 | |
| MRPL9 | CESC | chr1 | 151733963 | 151733963 | C | T | Silent | p.L184 | 1 |
| MRPL9 | SARC | chr1 | 151732554 | 151732554 | G | T | Missense_Mutation | 1 | |
| MRPL9 | UCEC | chr1 | 151734859 | 151734860 | - | C | Frame_Shift_Ins | p.E143fs | 1 |
| MRPL9 | BLCA | chr1 | 151733936 | 151733936 | G | T | Missense_Mutation | p.F193L | 1 |
| MRPL9 | LIHC | chr1 | 151734628 | 151734628 | T | C | Missense_Mutation | 1 |
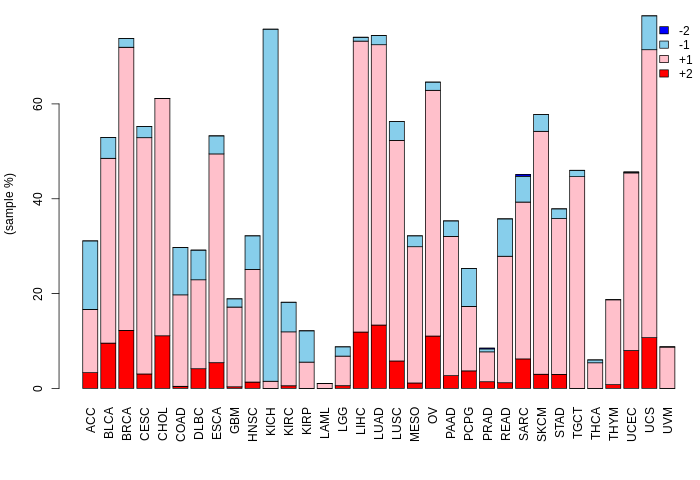
| Copy number variation (CNV) of MRPL9 * Click on the image to open the original image in a new window. |
 |
| Fusion gene breakpoints (product of the structural variants (SVs)) across MRPL9 * Click on the image to open the UCSC genome browser with custom track showing this image in a new window. |
 |
| Fusion genes with this translation factor from FusionGDB2.0. |
| FusionGDB2 ID | Disease | Sample | Hgene | Hchr | Hbp | Hstrand | Tgene | Tchr | Tbp | Tstrand |
| 96568 | HNSC | TCGA-CN-4731 | ANKFY1 | chr17 | 4145550 | - | MRPL9 | chr1 | 151733375 | - |
| 96568 | Non-Cancer | TCGA-BT-A20W-11A | ANXA9 | chr1 | 150959137 | + | MRPL9 | chr1 | 151732657 | - |
| 96568 | STAD | TCGA-CD-8525-01A | BCAM | chr19 | 45315805 | + | MRPL9 | chr1 | 151734028 | - |
| 96568 | Non-Cancer | TCGA-IP-7968-11A | DCAF15 | chr19 | 14065473 | + | MRPL9 | chr1 | 151734028 | - |
| 96568 | N/A | BP431009 | ELP4 | chr11 | 31561238 | + | MRPL9 | chr1 | 151732583 | + |
| 91103 | OV | TCGA-13-0765 | MRPL9 | chr1 | 151734580 | - | CYBA | chr16 | 88712605 | - |
| 94663 | N/A | AA700950 | MRPL9 | chr1 | 151734599 | - | NCAM1 | chr11 | 113148979 | + |
| 96051 | STAD | TCGA-RD-A8N9 | MRPL9 | chr1 | 151733291 | - | RBM5 | chr3 | 50150815 | + |
| 98506 | OV | TCGA-24-1428 | MRPL9 | chr1 | 151733291 | - | RORC | chr1 | 151789756 | - |
| 100204 | N/A | AI432441 | MRPL9 | chr1 | 151732422 | + | RPS6KA2 | chr6 | 166824834 | - |
| 96568 | N/A | BM837406 | STRN | chr2 | 37072134 | - | MRPL9 | chr1 | 151735972 | - |
| 96575 | BLCA | TCGA-GU-A764-01A | UCK2 | chr1 | 165797169 | + | MRPL9 | chr1 | 151734976 | - |
Top |
|
| Kaplan-Meier plots with logrank tests of overall survival (OS) |
 |
| Cancer type | Translation factor | Coefficent | Hazard ratio | Wald test pval | Likelihool ratio pval | Logrank test pval | # samples |
Top |
|
| Differential gene expression between female and male. (Wilcoxon test, pval<0.05) |
 |
| Cancer type | Translation factor | pval | adj.p |
| COAD | MRPL9 | 0.00327562718430628 | 0.092 |
| ESCA | MRPL9 | 0.00685524336224175 | 0.19 |
Top |
|
| Differential gene expression between young and old age groups (Wilcoxon test, pval<0.05) |
 |
| Cancer type | Translation factor | pval | adj.p |
| LIHC | MRPL9 | 0.014378652707464 | 0.45 |
| LUSC | MRPL9 | 0.0104975929699441 | 0.34 |
| LGG | MRPL9 | 0.000404647279508591 | 0.013 |
| PAAD | MRPL9 | 0.0285738280765235 | 0.83 |
| UVM | MRPL9 | 0.0444012151703387 | 1 |
| UCEC | MRPL9 | 0.048621940355047 | 1 |
| ESCA | MRPL9 | 0.027606411753896 | 0.83 |
Top |
|
| Drugs targeting genes involved in this translation factor. (DrugBank Version 5.1.8 2021-05-08) |
| UniProtAcc | DrugBank ID | Drug name | Drug activity | Drug type | Drug status |
Top |
|
| Diseases associated with this translation factor. (DisGeNet 4.0) |
| Disease ID | Disease Name | # PubMeds | Disease source |
| C0006142 | Malignant neoplasm of breast | 1 | CTD_human |
| C0678222 | Breast Carcinoma | 1 | CTD_human |
| C1257931 | Mammary Neoplasms, Human | 1 | CTD_human |
| C4704874 | Mammary Carcinoma, Human | 1 | CTD_human |
(UTHealth)
Web File Viewing | Emergency Information |Campus Carry|Site Policies