
|
||||||
|

Translation Factor: EIF2S2 (NCBI Gene ID:8894) |
|
 Gene Summary Gene Summary |
| Gene Information | Gene Name: EIF2S2 | Gene ID: 8894 | Gene Symbol | EIF2S2 | Gene ID | 8894 |
| Gene Name | eukaryotic translation initiation factor 2 subunit beta | |
| Synonyms | EIF2|EIF2B|EIF2beta|PPP1R67|eIF-2-beta | |
| Cytomap | 20q11.22 | |
| Type of Gene | protein-coding | |
| Description | eukaryotic translation initiation factor 2 subunit 2eukaryotic translation initiation factor 2, subunit 2 beta, 38kDaprotein phosphatase 1, regulatory subunit 67 | |
| Modification date | 20200313 | |
| UniProtAcc | P20042 | |
| Child GO biological process term(s) under GO:0006412 |
| GO ID | GO term |
| GO:0006417 | Regulation of translation |
| GO:0008135 | Translation factor activity, RNA binding |
| GO:0002181 | Cytoplasmic translation |
| GO:0006413 | Translational initiation |
| GO:0006412 | Translation |
| Gene ontology of translaction factor with evidence of Inferred from Direct Assay (IDA) from Entrez |
| Partner | Gene | GO ID | GO term | PubMed ID |
| Inferred gene age of translation factor. |
| Gene | Inferred gene age group among (0 - 67.6], (67.6 - 355.7], (355.7 - 733], (733 - 1119.25], >1119.25 |
| EIF2S2 | >1119.25 |
Top |
|
| We searched PubMed using 'EIF2S2[title] AND translation [title] AND human.' |
| Gene | Title | PMID |
| EIF2S2 | . | . |
Top |
|
| Skipped exons in TCGA and GTEx based on Ensembl gene isoform structure. * Click on the image to open the UCSC genome browser with custom track showing this image in a new window. For more annotations, please visit our ExonSkipDB. |
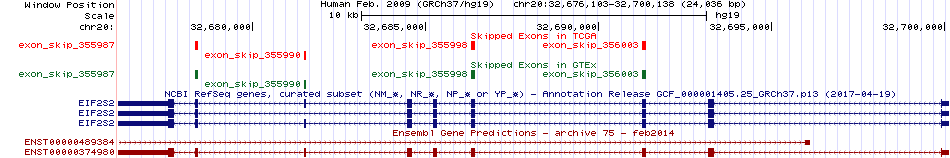 |
| Open reading frame (ORF) analsis of exon skipping events based on Ensembl gene isoform structure. * Click on the break point to see the gene structure around the break point region using the UCSC Genome Browser. |
| ENST | Exon skip start (DNA) | Exon Skip end (DNA) | ORF |
| ENST00000374980 | 32678322 | 32678408 | Frame-shift |
| ENST00000374980 | 32681480 | 32681537 | In-frame |
| ENST00000374980 | 32686303 | 32686439 | Frame-shift |
| ENST00000374980 | 32691267 | 32691371 | Frame-shift |
| Exon skipping position in the amino acid sequence. |
| ENST | Exon skip start (DNA) | Exon Skip end (DNA) | Len(transcript seq) | Exon skip start (mRNA) | Exon Skip end (mRNA) | Len(amino acid seq) | Exon skip start (AA) | Exon Skip end (AA) |
| ENST00000374980 | 32681480 | 32681537 | 2673 | 906 | 962 | 333 | 228 | 246 |
| Potentially (partially) lost protein functional features of UniProt. |
| UniProtAcc | Exon skip start (AA) | Exon Skip end (AA) | Function feature start (AA) | Function feature end (AA) | Functional feature type | Functional feature desc. |
| P20042 | 228 | 246 | 2 | 333 | Chain | ID=PRO_0000137406;Note=Eukaryotic translation initiation factor 2 subunit 2 |
Top |
|
| Gene expression level across TCGA pancancer |
 |
| Gene expression level across GTEx pantissue |
 |
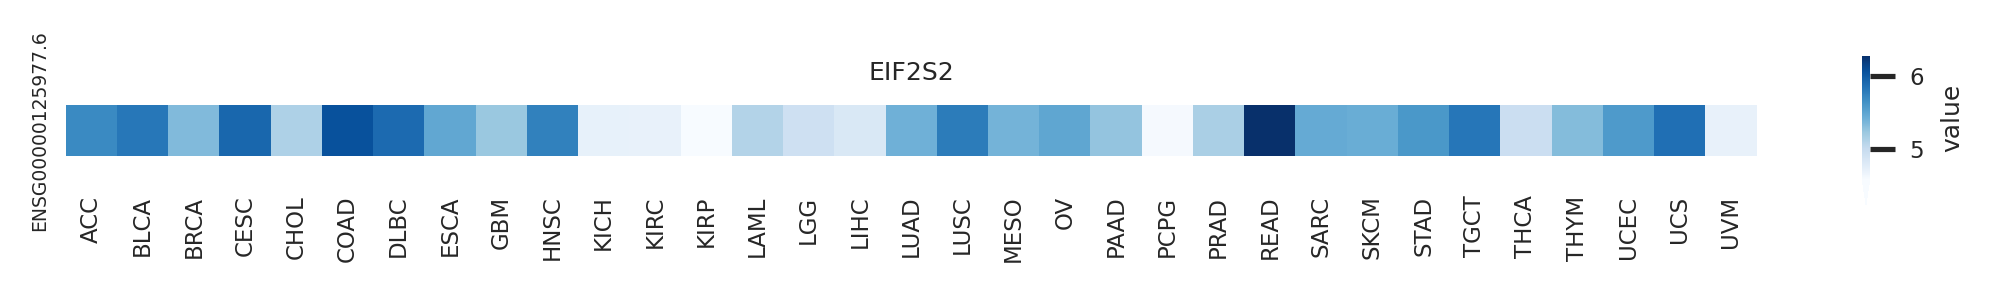
| Expression level of gene isoforms across TCGA pancancer |
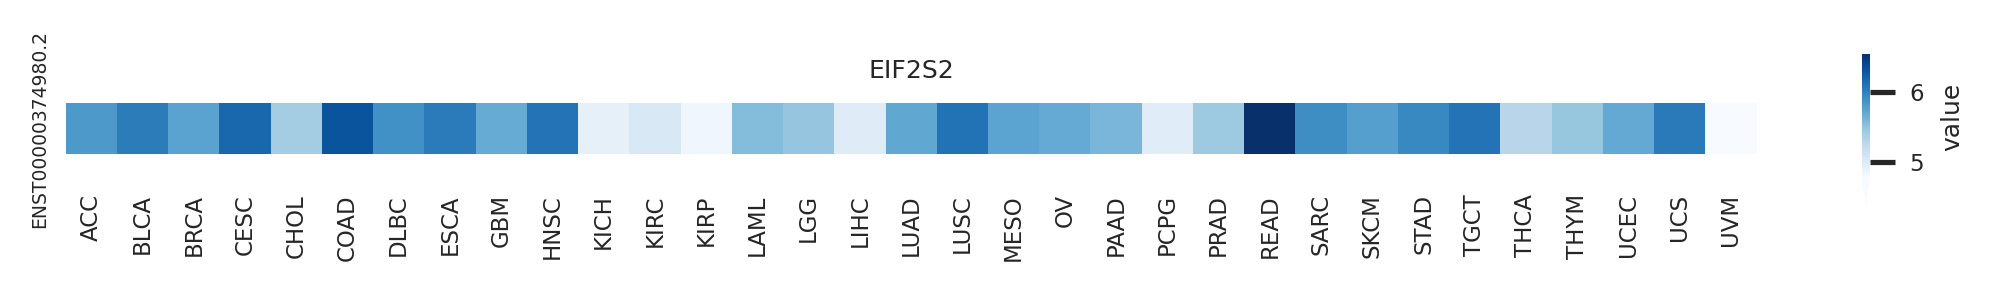 |
| Expression level of gene isoforms across GTEx pantissue |
 |
| Cancer(tissue) type-specific expression level of Translation factor using z-score distriution |
 |
| Differential expression between tumor and matched normal (in the cancer types with more than 10 matched samples) |
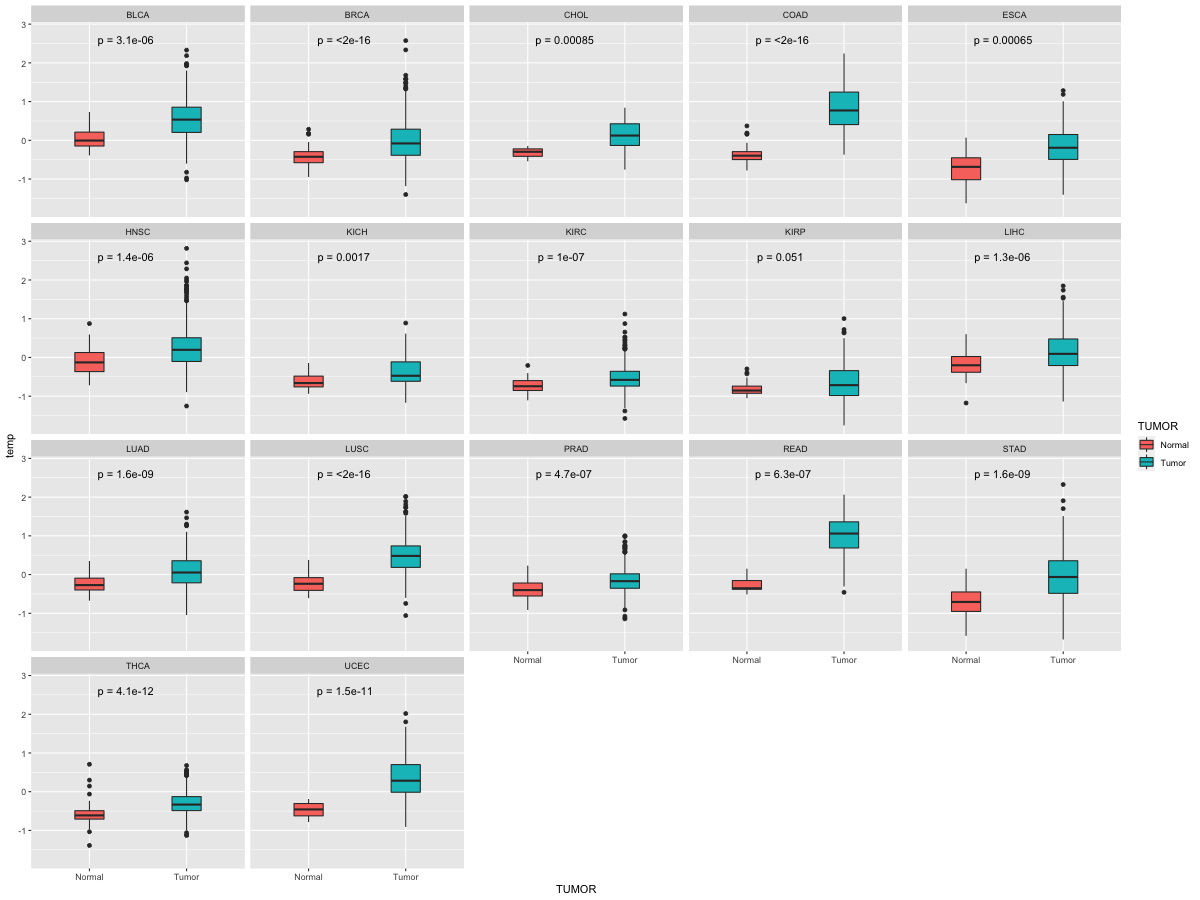 |
| Cancer type | Translation factor | FC | adj.pval |
| KICH | EIF2S2 | -1.06278646532411 | 0.00308787822723389 |
| BRCA | EIF2S2 | -2.57303037687825 | 1.70212120584918e-09 |
| STAD | EIF2S2 | -2.13186277769467 | 3.17529775202275e-05 |
Top |
|
| Translation factor expression regulation through miRNA binding |
| Cancer type | Gene | miRNA | TargetScan binding score (Context++ score percentile) | Coefficient | Pvalue |
| Translation factor expression regulation through methylation in the promoter of Translation factor |
 |
| Cancer type | Gene | methyl group b | methyl group a | DEG pval | avg methyl in b | avg methyl in a | avg exp in b | avg exp in a |
| Translation factor expression regulation through methylation in the gene body of Translation factor (positive regulation) |
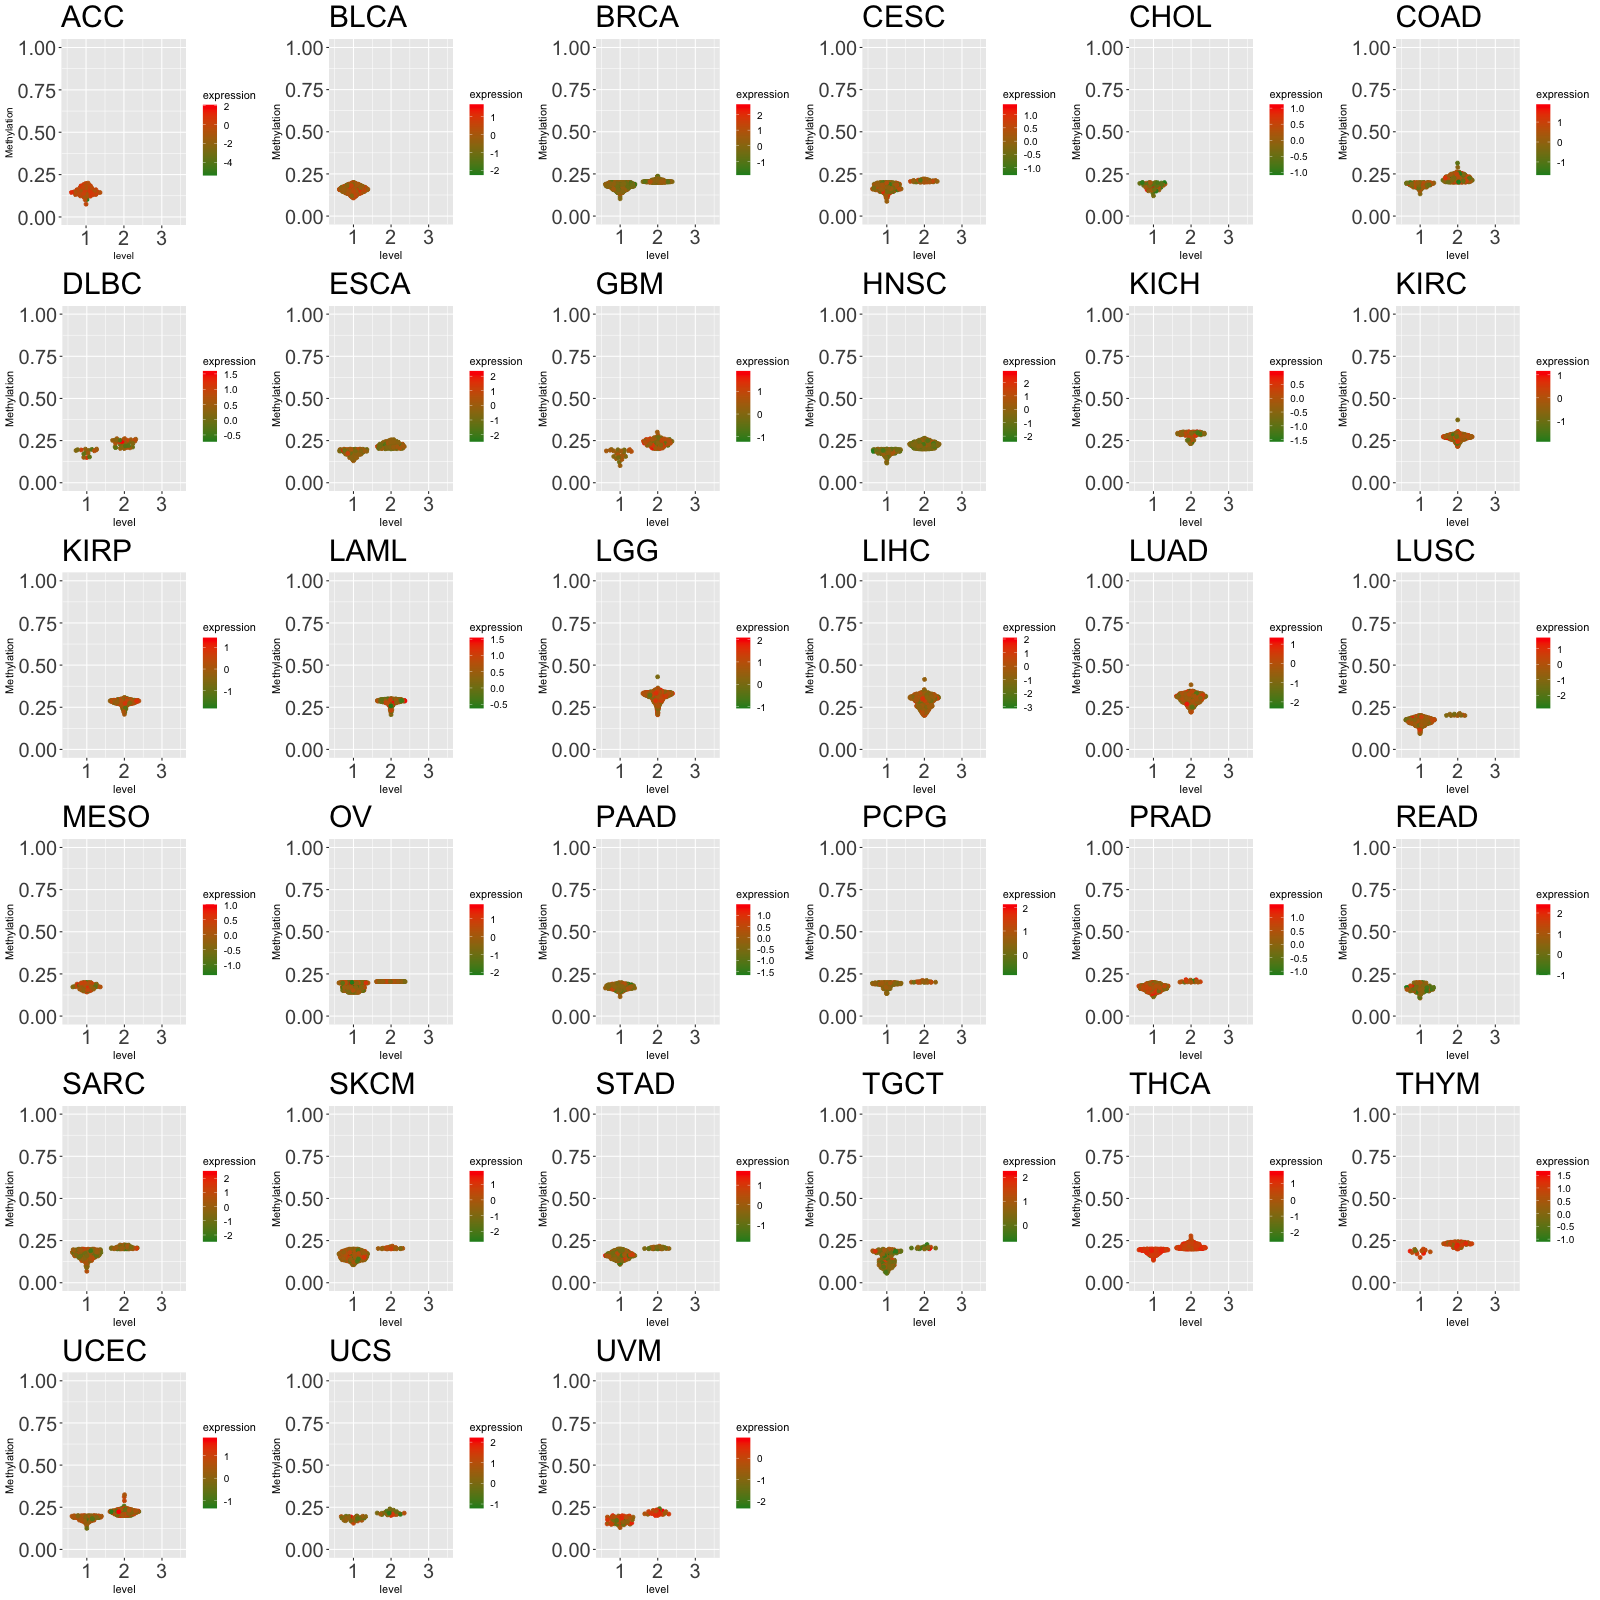 |
| Cancer type | Gene | methyl group b | methyl group a | DEG pval | avg methyl in b | avg methyl in a | avg exp in b | avg exp in a |
| Translation factor expression regulation through copy number variation of Translation factor |
 |
| Cancer type | Gene | Coefficient | Pvalue |
| THCA | EIF2S2 | 0.174464216 | 0.046417225 |
Top |
|
| Strongly correlated genes belong to cellular important gene groups with EIF2S2 (coefficient>0.8, pval<0.05, node color based on FC between tumor and matched normal). Significantly associated important genes in the individual cancer types. * Cell metabolism gene: cell metabolism genes from REACTOME (black edge), IUPHAR: drug target genes from IUPHAR (blue edge), Kinase: human kinase genes (brown edge), CGC: cancer gene census genes (orange edge), TSG: tumor suppresor genes (purple edge), Epifactor: epigenetic factors (light blue edge), TF: transcription factors (green) |
 |
| Cancer type | Gene group | Translation factor | Correlated gene | Coefficient | Pvalue |
| COAD | Cell metabolism gene | EIF2S2 | RPN2 | 0.818001239 | 1.57E-80 |
| COAD | Cell metabolism gene | EIF2S2 | PFDN4 | 0.825515277 | 3.10E-83 |
| COAD | Cell metabolism gene | EIF2S2 | AHCY | 0.829661324 | 8.75E-85 |
| COAD | Cell metabolism gene | EIF2S2 | DPM1 | 0.864713446 | 8.17E-100 |
| COAD | Cell metabolism gene | EIF2S2 | RAE1 | 0.865170333 | 4.89E-100 |
| COAD | Cell metabolism gene | EIF2S2 | PSMA7 | 0.874382327 | 1.02E-104 |
| COAD | IUPHAR | EIF2S2 | TP53RK | 0.810407452 | 6.38E-78 |
| COAD | IUPHAR | EIF2S2 | AHCY | 0.829661324 | 8.75E-85 |
| COAD | Kinase | EIF2S2 | TP53RK | 0.810407452 | 6.38E-78 |
| DLBC | Cell metabolism gene | EIF2S2 | EBP | 0.803198918 | 6.46E-12 |
| DLBC | Cell metabolism gene | EIF2S2 | SNRPB | 0.814040278 | 1.99E-12 |
| DLBC | Cell metabolism gene | EIF2S2 | PSMC3 | 0.818558194 | 1.19E-12 |
| DLBC | Cell metabolism gene | EIF2S2 | PSMA4 | 0.818681823 | 1.17E-12 |
| DLBC | Cell metabolism gene | EIF2S2 | PSMD8 | 0.822192165 | 7.79E-13 |
| DLBC | Cell metabolism gene | EIF2S2 | PSMA7 | 0.84014165 | 8.27E-14 |
| DLBC | Cell metabolism gene | EIF2S2 | TIMM50 | 0.842383023 | 6.13E-14 |
| DLBC | Cell metabolism gene | EIF2S2 | PSMB7 | 0.858207252 | 6.44E-15 |
| DLBC | Cell metabolism gene | EIF2S2 | TIMM10 | 0.871331751 | 7.99E-16 |
| DLBC | CGC | EIF2S2 | U2AF1 | 0.806426396 | 4.58E-12 |
| DLBC | TSG | EIF2S2 | PHB | 0.828911482 | 3.47E-13 |
| READ | Cell metabolism gene | EIF2S2 | RPN2 | 0.800533514 | 1.22E-24 |
| READ | Cell metabolism gene | EIF2S2 | PSMA7 | 0.843580141 | 1.43E-29 |
| READ | Cell metabolism gene | EIF2S2 | AHCY | 0.844964929 | 9.37E-30 |
| READ | Cell metabolism gene | EIF2S2 | RAE1 | 0.849005418 | 2.68E-30 |
| READ | Cell metabolism gene | EIF2S2 | MOCS3 | 0.855895017 | 2.90E-31 |
| READ | IUPHAR | EIF2S2 | AHCY | 0.844964929 | 9.37E-30 |
| READ | IUPHAR | EIF2S2 | TP53RK | 0.84634291 | 6.14E-30 |
| READ | Kinase | EIF2S2 | TP53RK | 0.84634291 | 6.14E-30 |
| TGCT | Cell metabolism gene | EIF2S2 | SNRPD1 | 0.800554244 | 4.52E-36 |
| TGCT | CGC | EIF2S2 | HMGA1 | 0.83115177 | 4.30E-41 |
| TGCT | IUPHAR | EIF2S2 | MFSD2B | 0.808943189 | 2.34E-37 |
| TGCT | TF | EIF2S2 | HMGA1 | 0.83115177 | 4.30E-41 |
| TGCT | TSG | EIF2S2 | PHB | 0.85455881 | 1.14E-45 |
| THYM | Cell metabolism gene | EIF2S2 | SNRPD1 | 0.800678199 | 1.80E-28 |
| THYM | Cell metabolism gene | EIF2S2 | RAE1 | 0.803515962 | 8.34E-29 |
| THYM | Cell metabolism gene | EIF2S2 | PSME1 | 0.804841685 | 5.80E-29 |
| THYM | Cell metabolism gene | EIF2S2 | CCT7 | 0.805873822 | 4.36E-29 |
| THYM | Cell metabolism gene | EIF2S2 | SEC61G | 0.807443466 | 2.82E-29 |
| THYM | Cell metabolism gene | EIF2S2 | PSMA5 | 0.807491592 | 2.78E-29 |
| THYM | Cell metabolism gene | EIF2S2 | IDH3B | 0.815537829 | 2.77E-30 |
| THYM | Cell metabolism gene | EIF2S2 | SNRPB | 0.819784888 | 7.85E-31 |
| THYM | Cell metabolism gene | EIF2S2 | POLR3K | 0.8262332 | 1.08E-31 |
| THYM | Cell metabolism gene | EIF2S2 | DTYMK | 0.831576858 | 1.97E-32 |
| THYM | Cell metabolism gene | EIF2S2 | FDPS | 0.833816075 | 9.45E-33 |
| THYM | Cell metabolism gene | EIF2S2 | NOP56 | 0.860029468 | 7.23E-37 |
| THYM | Cell metabolism gene | EIF2S2 | PSMA7 | 0.864602512 | 1.14E-37 |
| THYM | Cell metabolism gene | EIF2S2 | SNRPE | 0.87353431 | 2.50E-39 |
| THYM | CGC | EIF2S2 | CDK4 | 0.813756261 | 4.66E-30 |
| THYM | Epifactor | EIF2S2 | RUVBL1 | 0.80056686 | 1.86E-28 |
| THYM | Epifactor | EIF2S2 | HDGF | 0.813922857 | 4.44E-30 |
| THYM | Epifactor | EIF2S2 | ENY2 | 0.824950479 | 1.61E-31 |
| THYM | IUPHAR | EIF2S2 | UCHL3 | 0.801510037 | 1.44E-28 |
| THYM | IUPHAR | EIF2S2 | CDK4 | 0.813756261 | 4.66E-30 |
| THYM | IUPHAR | EIF2S2 | FDPS | 0.833816075 | 9.45E-33 |
| THYM | IUPHAR | EIF2S2 | ECE2 | 0.847383327 | 8.74E-35 |
| THYM | Kinase | EIF2S2 | CDK4 | 0.813756261 | 4.66E-30 |
| UCS | Cell metabolism gene | EIF2S2 | SNRPD1 | 0.800678199 | 1.80E-28 |
| UCS | Cell metabolism gene | EIF2S2 | RAE1 | 0.803515962 | 8.34E-29 |
| UCS | Cell metabolism gene | EIF2S2 | PSME1 | 0.804841685 | 5.80E-29 |
| UCS | Cell metabolism gene | EIF2S2 | CCT7 | 0.805873822 | 4.36E-29 |
| UCS | Cell metabolism gene | EIF2S2 | SEC61G | 0.807443466 | 2.82E-29 |
| UCS | Cell metabolism gene | EIF2S2 | PSMA5 | 0.807491592 | 2.78E-29 |
| UCS | Cell metabolism gene | EIF2S2 | IDH3B | 0.815537829 | 2.77E-30 |
| UCS | Cell metabolism gene | EIF2S2 | SNRPB | 0.819784888 | 7.85E-31 |
| UCS | Cell metabolism gene | EIF2S2 | POLR3K | 0.8262332 | 1.08E-31 |
| UCS | Cell metabolism gene | EIF2S2 | DTYMK | 0.831576858 | 1.97E-32 |
| UCS | Cell metabolism gene | EIF2S2 | FDPS | 0.833816075 | 9.45E-33 |
| UCS | Cell metabolism gene | EIF2S2 | NOP56 | 0.860029468 | 7.23E-37 |
| UCS | Cell metabolism gene | EIF2S2 | PSMA7 | 0.864602512 | 1.14E-37 |
| UCS | Cell metabolism gene | EIF2S2 | SNRPE | 0.87353431 | 2.50E-39 |
| UCS | CGC | EIF2S2 | CDK4 | 0.813756261 | 4.66E-30 |
| UCS | Epifactor | EIF2S2 | RUVBL1 | 0.80056686 | 1.86E-28 |
| UCS | Epifactor | EIF2S2 | HDGF | 0.813922857 | 4.44E-30 |
| UCS | Epifactor | EIF2S2 | ENY2 | 0.824950479 | 1.61E-31 |
| UCS | IUPHAR | EIF2S2 | UCHL3 | 0.801510037 | 1.44E-28 |
| UCS | IUPHAR | EIF2S2 | CDK4 | 0.813756261 | 4.66E-30 |
| UCS | IUPHAR | EIF2S2 | FDPS | 0.833816075 | 9.45E-33 |
| UCS | IUPHAR | EIF2S2 | ECE2 | 0.847383327 | 8.74E-35 |
| UCS | Kinase | EIF2S2 | CDK4 | 0.813756261 | 4.66E-30 |
| UVM | Cell metabolism gene | EIF2S2 | NUPL2 | 0.800298757 | 5.27E-19 |
| UVM | Cell metabolism gene | EIF2S2 | DPM1 | 0.804357268 | 2.57E-19 |
| UVM | Cell metabolism gene | EIF2S2 | MED7 | 0.833331162 | 8.91E-22 |
| UVM | Cell metabolism gene | EIF2S2 | SRP19 | 0.846928856 | 4.24E-23 |
| UVM | Cell metabolism gene | EIF2S2 | GRPEL2 | 0.847322679 | 3.86E-23 |
| UVM | Epifactor | EIF2S2 | VRK1 | 0.800108453 | 5.44E-19 |
| UVM | Epifactor | EIF2S2 | TLK1 | 0.803983627 | 2.75E-19 |
| UVM | Epifactor | EIF2S2 | CDK7 | 0.815152904 | 3.50E-20 |
| UVM | Epifactor | EIF2S2 | TAF9 | 0.844705444 | 7.11E-23 |
| UVM | IUPHAR | EIF2S2 | VRK1 | 0.800108453 | 5.44E-19 |
| UVM | IUPHAR | EIF2S2 | TLK1 | 0.803983627 | 2.75E-19 |
| UVM | IUPHAR | EIF2S2 | CDK7 | 0.815152904 | 3.50E-20 |
| UVM | IUPHAR | EIF2S2 | CSNK1G3 | 0.81913895 | 1.62E-20 |
| UVM | IUPHAR | EIF2S2 | CSNK1A1 | 0.824823513 | 5.23E-21 |
| UVM | IUPHAR | EIF2S2 | RIOK2 | 0.837304743 | 3.77E-22 |
| UVM | Kinase | EIF2S2 | VRK1 | 0.800108453 | 5.44E-19 |
| UVM | Kinase | EIF2S2 | TLK1 | 0.803983627 | 2.75E-19 |
| UVM | Kinase | EIF2S2 | CDK7 | 0.815152904 | 3.50E-20 |
| UVM | Kinase | EIF2S2 | CSNK1G3 | 0.81913895 | 1.62E-20 |
| UVM | Kinase | EIF2S2 | CSNK1A1 | 0.824823513 | 5.23E-21 |
| UVM | Kinase | EIF2S2 | RIOK2 | 0.837304743 | 3.77E-22 |
| UVM | TF | EIF2S2 | CEBPZ | 0.802061283 | 3.86E-19 |
| UVM | TF | EIF2S2 | ZNF140 | 0.808437248 | 1.23E-19 |
| UVM | TF | EIF2S2 | GPBP1 | 0.830469911 | 1.63E-21 |
| UVM | TSG | EIF2S2 | RBBP8 | 0.804708413 | 2.41E-19 |
| UVM | TSG | EIF2S2 | CSNK1A1 | 0.824823513 | 5.23E-21 |
Top |
|
| Protein 3D structure Visit iCn3D. |
Top |
|
| Protein-protein interaction networks * Overlap between up-regulated DEGs (log2FC<-1 and adj.P<0.05) and STRING PPI network (center: Translation factor, node: DEGs, edges: weighted by -log2(adj.P)) |
 |
| Overlap between down-regulated DEGs (log2FC>1 and adj.P<0.05) and STRING PPI network (center: Translation factor, node: DEGs, edges: weighted by -log2(adj.P)) |
 |
 * Edge colors based on TCGA cancer types. |
| * Overlap between DEGs (log2FC>1 and adj.P<0.05) and STRING PPI network per cancer (center: Translation factor, node: DEGs, node color: log2FC, edges: weighted by -log2(adj.P)) |
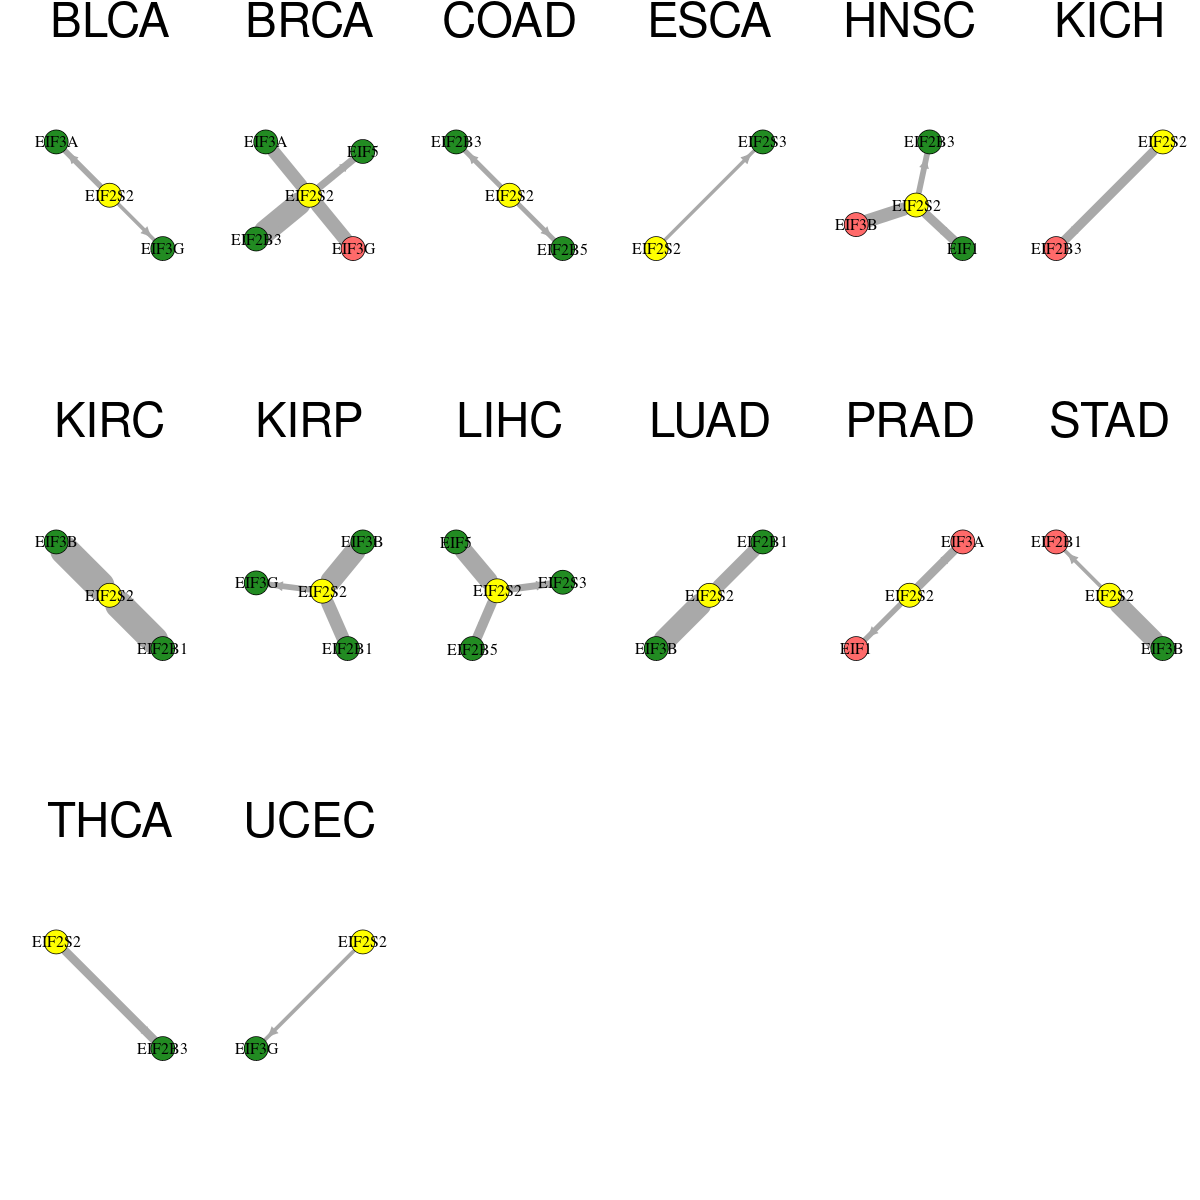 |
| Cancer type | Translation factor | Interacting protein coding gene | FC | adj.pval |
| LIHC | EIF2S2 | EIF2B5 | -2.17335102876885 | 0.000112780019881286 |
| KICH | EIF2S2 | EIF2B3 | 2.17795043401278 | 0.000216901302337646 |
| HNSC | EIF2S2 | EIF1 | -4.13399438210909 | 0.000228392819053625 |
| PRAD | EIF2S2 | EIF3A | 1.13680328391952 | 0.000363360004697762 |
| THCA | EIF2S2 | EIF2B3 | -2.27193247701228 | 0.000372452864704637 |
| BRCA | EIF2S2 | EIF5 | -1.16704316213885 | 0.00107943958337404 |
| LIHC | EIF2S2 | EIF2S3 | -4.62530933210412 | 0.00154404530385922 |
| HNSC | EIF2S2 | EIF2B3 | -1.66956934127194 | 0.00459462782941955 |
| KIRP | EIF2S2 | EIF3G | -2.4178322962129 | 0.00471024587750435 |
| BLCA | EIF2S2 | EIF3A | -4.45104058307747 | 0.00532913208007812 |
| PRAD | EIF2S2 | EIF1 | 1.32822648991353 | 0.00674237731133815 |
| COAD | EIF2S2 | EIF2B3 | -1.60183733464354 | 0.00938254594802858 |
| COAD | EIF2S2 | EIF2B5 | -3.82949281161428 | 0.011966735124588 |
| UCEC | EIF2S2 | EIF3G | -3.35078334696571 | 0.03125 |
| BLCA | EIF2S2 | EIF3G | -3.07707559649091 | 0.0323410034179688 |
| STAD | EIF2S2 | EIF2B1 | 1.06970835543362 | 0.0324882394634187 |
| ESCA | EIF2S2 | EIF2S3 | -1.31322237574718 | 0.0419921875 |
| LUAD | EIF2S2 | EIF3B | -5.80435587546762 | 1.0542655358657e-09 |
| BRCA | EIF2S2 | EIF3G | 1.87948385011271 | 1.9107949115022e-06 |
| KIRC | EIF2S2 | EIF3B | -1.56313263784517 | 2.35252849767166e-12 |
| STAD | EIF2S2 | EIF3B | -4.7724660972007 | 3.25962901115418e-08 |
| HNSC | EIF2S2 | EIF3B | 2.6202554263604 | 4.48234413852334e-06 |
| KIRP | EIF2S2 | EIF3B | -2.7592297042974 | 4.6566128730774e-09 |
| LIHC | EIF2S2 | EIF5 | -2.12060405382854 | 4.66164898670786e-08 |
| KIRP | EIF2S2 | EIF2B1 | -2.14953108463177 | 5.24520874023438e-06 |
| LUAD | EIF2S2 | EIF2B1 | -2.39668434561352 | 5.70558004016916e-06 |
| BRCA | EIF2S2 | EIF2B3 | -1.42398409637427 | 6.27134207487183e-10 |
| BRCA | EIF2S2 | EIF3A | -1.218215573148 | 7.39403582934137e-06 |
| KIRC | EIF2S2 | EIF2B1 | -1.83635928054145 | 7.43306349049898e-12 |
| Protein-protein interactors with this translation factor (BIOGRID-3.4.160) |
| PPI interactors with EIF2S2 |
| PLEKHM1, CRMP1, KIAA1377, ZBTB16, APLP1, CCDC90B, TLE1, TP53, UNC119, EIF5, PRKDC, Eif5, H2AFX, DCC, HDGF, CAND1, APP, EIF2S1, PAXIP1, CSNK2A1, CSNK2B, UPF1, MMS19, HMGA1, GCN1L1, rev, RPA3, RPA2, RPA1, SUZ12, RNF2, MAST3, ESR1, KLHL20, MBD5, SERPINB5, HOXB5, ZCCHC7, EIF2S3, PRMT7, CDC123, ETFA, RNF26, CYP1A1, RPS6KB2, DDX56, ATAD3B, CDC5L, ETF1, FBL, MRTO4, MYL9, SUB1, KIF23, NCAPD3, NEMF, NOP56, NOP58, NSA2, RPL15, RPL37A, NTRK1, NCK1, XPO1, COPS7A, EXOSC4, EXOSC1, Rrbp1, Ksr1, FAU, UBA52, EIF5A, RPS19, RPS12, RPS10, NPM1, RAN, ATP5C1, VAT1, PA2G4, STIP1, CYLD, TRIM25, G3BP1, GSK3A, PCBP1, RAD18, PRPF8, EFTUD2, TNIP2, RIOK1, AGR2, RECQL4, MYC, RAB11A, RAB9A, BET1, TUBA1A, TOMM20, SFXN1, TOMM22, AURKAIP1, METTL14, PHB, MAPT, USP14, NR2C2, UBQLN2, MTDH, NHLRC2, KRAS, DDX60, SNRNP70, Dppa3, CDC14A, PTPN6, BIRC3, STAU1, NFX1, BRD7, TRIM28, CMTR1, CUL7, PLEKHA4, HCVgp1, ZC3H18, MAP4K1, PRKCB, KTN1, CIT, MAD2L2, C12orf49, INS, BRD4, NUPR1, Apc2, nsp15, USP10, OGT, CD274, TULP3, UFL1, DDRGK1, FZR1, WDR5, TOR1B, FBXW7, M, nsp16, nsp4, ORF10, ORF7a, ORF8, N, |
Top |
|
| Clinically associated variants from ClinVar. |
| Gene | Chr | Position | RefSeq | VarSeq | RefSeeq | VarType | Pathogenic | Disease | VarInfo |
| EIF2S2 | chr20 | 32677551 | A | G | single_nucleotide_variant | Likely_benign | not_provided | SO:0001819|synonymous_variant | SO:0001819|synonymous_variant |
| EIF2S2 | chr20 | 32685228 | G | A | single_nucleotide_variant | Benign | not_provided | SO:0001819|synonymous_variant | SO:0001819|synonymous_variant |
| EIF2S2 | chr20 | 32693235 | C | G | single_nucleotide_variant | Likely_benign | not_provided | SO:0001819|synonymous_variant | SO:0001819|synonymous_variant |
| nsSNVs with sample frequency (size of circle) from TCGA 33 cancers. |
 |
| SNVs and Indels |
| Gene | Cancer type | Chromosome | Start | End | RefSeeq | MutSeq | Mutation type | AAchange | # samples |
| EIF2S2 | COAD | chr20 | 32684576 | 32684576 | C | A | Missense_Mutation | p.K190N | 5 |
| EIF2S2 | BRCA | chr20 | 32685285 | 32685285 | G | C | Missense_Mutation | p.I157M | 4 |
| EIF2S2 | UCEC | chr20 | 32693352 | 32693352 | C | A | Splice_Site | e2-1 | 4 |
| EIF2S2 | DLBC | chr20 | 32677684 | 32677684 | C | T | Missense_Mutation | p.R285Q | 3 |
| EIF2S2 | UCEC | chr20 | 32677652 | 32677652 | G | C | Missense_Mutation | p.R296G | 3 |
| EIF2S2 | LIHC | chr20 | 32693175 | 32693175 | T | - | Splice_Site | p.K64_splice | 3 |
| EIF2S2 | SARC | chr20 | 32684518 | 32684518 | C | T | Missense_Mutation | p.V210I | 3 |
| EIF2S2 | UCS | chr20 | 32677668 | 32677668 | G | A | Silent | p.I290I | 2 |
| EIF2S2 | HNSC | chr20 | 32677564 | 32677564 | C | T | Missense_Mutation | p.R325Q | 2 |
| EIF2S2 | THCA | chr20 | 32677564 | 32677564 | C | G | Missense_Mutation | p.R325P | 2 |
| EIF2S2 | HNSC | chr20 | 32693175 | 32693175 | T | - | Frame_Shift_Del | p.K64fs | 2 |
| EIF2S2 | HNSC | chr20 | 32677564 | 32677564 | C | T | Missense_Mutation | 2 | |
| EIF2S2 | UCEC | chr20 | 32681530 | 32681530 | G | A | Missense_Mutation | p.R231C | 2 |
| EIF2S2 | LIHC | chr20 | 32677592 | 32677592 | T | - | Frame_Shift_Del | p.T316fs | 2 |
| EIF2S2 | UCEC | chr20 | 32684501 | 32684501 | C | A | Missense_Mutation | p.K215N | 2 |
| EIF2S2 | BRCA | chr20 | 32678367 | 32678367 | C | T | Missense_Mutation | p.R261K | 2 |
| EIF2S2 | UCEC | chr20 | 32684509 | 32684509 | C | T | Missense_Mutation | p.G213R | 2 |
| EIF2S2 | UCEC | chr20 | 32684602 | 32684602 | G | A | Nonsense_Mutation | p.R182* | 2 |
| EIF2S2 | HNSC | chr20 | 32685311 | 32685311 | C | A | Nonsense_Mutation | p.E149* | 2 |
| EIF2S2 | CESC | chr20 | 32686316 | 32686316 | C | G | Missense_Mutation | 2 | |
| EIF2S2 | STAD | chr20 | 32677677 | 32677677 | C | T | Silent | p.P287P | 2 |
| EIF2S2 | HNSC | chr20 | 32686339 | 32686339 | A | G | Missense_Mutation | p.F133S | 1 |
| EIF2S2 | LUAD | chr20 | 32684606 | 32684606 | C | T | Silent | p.L180L | 1 |
| EIF2S2 | CESC | chr20 | 32686316 | 32686316 | C | G | Missense_Mutation | p.E141Q | 1 |
| EIF2S2 | STAD | chr20 | 32693225 | 32693225 | G | A | Missense_Mutation | p.P48S | 1 |
| EIF2S2 | LUSC | chr20 | 32677584 | 32677584 | G | T | Missense_Mutation | p.F318L | 1 |
| EIF2S2 | COAD | chr20 | 32678368 | 32678368 | T | G | Silent | p.R261R | 1 |
| EIF2S2 | STAD | chr20 | 32677651 | 32677651 | C | T | Missense_Mutation | p.R296Q | 1 |
| EIF2S2 | HNSC | chr20 | 32685276 | 32685276 | A | G | Silent | p.S160S | 1 |
| EIF2S2 | OV | chr20 | 32156956 | 32156956 | C | T | Missense_Mutation | p.M24I | 1 |
| EIF2S2 | BLCA | chr20 | 32677681 | 32677681 | G | A | Missense_Mutation | 1 | |
| EIF2S2 | PCPG | chr20 | 32691357 | 32691357 | G | C | Missense_Mutation | p.L70V | 1 |
| EIF2S2 | THYM | chr20 | 32686326 | 32686326 | A | G | Silent | 1 | |
| EIF2S2 | KIRC | chr20 | 32699916 | 32699916 | T | A | Translation_Start_Site | p.M1L | 1 |
| EIF2S2 | BLCA | chr20 | 32684519 | 32684519 | G | A | Silent | 1 | |
| EIF2S2 | SARC | chr20 | 32686422 | 32686422 | A | G | Silent | 1 | |
| EIF2S2 | GBM | chr20 | 32677582 | 32677582 | T | C | Missense_Mutation | p.Q319R | 1 |
| EIF2S2 | LIHC | chr20 | 32686360 | 32686360 | T | C | Missense_Mutation | p.K126R | 1 |
| EIF2S2 | BLCA | chr20 | 32677681 | 32677681 | G | A | Missense_Mutation | p.S286L | 1 |
| EIF2S2 | SARC | chr20 | 32684518 | 32684518 | C | T | Missense_Mutation | 1 | |
| EIF2S2 | BLCA | chr20 | 32684519 | 32684519 | G | A | Silent | p.V209V | 1 |
| EIF2S2 | SARC | chr20 | 32677559 | 32677559 | G | T | Missense_Mutation | 1 | |
| EIF2S2 | HNSC | chr20 | 32685276 | 32685276 | A | G | Silent | 1 | |
| EIF2S2 | SARC | chr20 | 32686422 | 32686422 | A | G | Silent | p.S105S | 1 |
| EIF2S2 | HNSC | chr20 | 32686339 | 32686339 | A | G | Missense_Mutation | 1 | |
| EIF2S2 | LIHC | chr20 | 32678354 | 32678354 | T | - | Frame_Shift_Del | p.K265fs | 1 |
| EIF2S2 | LUAD | chr20 | 32677568 | 32677568 | T | C | Missense_Mutation | p.K324E | 1 |
| EIF2S2 | SKCM | chr20 | 32693176 | 32693176 | T | C | Missense_Mutation | p.K64R | 1 |
| EIF2S2 | HNSC | chr20 | 32677565 | 32677565 | G | A | Nonsense_Mutation | p.R325* | 1 |
| EIF2S2 | LUAD | chr20 | 32677589 | 32677589 | C | T | Missense_Mutation | p.G317S | 1 |
| EIF2S2 | CESC | chr20 | 32686325 | 32686325 | C | A | Nonsense_Mutation | 1 |
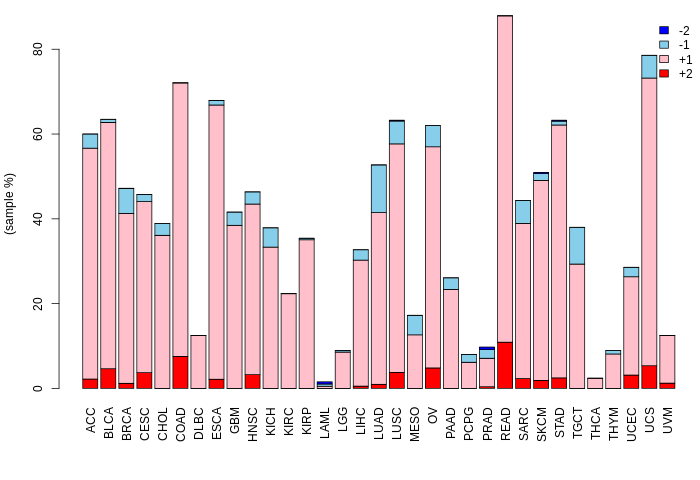
| Copy number variation (CNV) of EIF2S2 * Click on the image to open the original image in a new window. |
 |
| Fusion gene breakpoints (product of the structural variants (SVs)) across EIF2S2 * Click on the image to open the UCSC genome browser with custom track showing this image in a new window. |
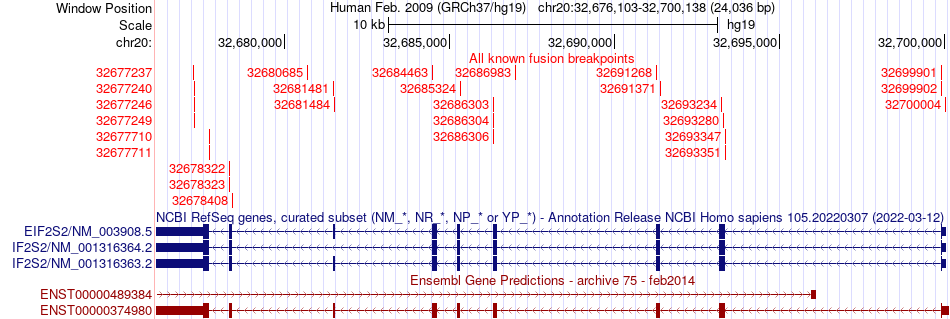 |
| Fusion genes with this translation factor from FusionGDB2.0. |
| FusionGDB2 ID | Disease | Sample | Hgene | Hchr | Hbp | Hstrand | Tgene | Tchr | Tbp | Tstrand |
| 102663 | N/A | BU543690 | APLP2 | chr11 | 129991623 | + | EIF2S2 | chr20 | 32693280 | - |
| 102663 | BLCA | TCGA-GV-A40E | ARIH1 | chr15 | 72767355 | + | EIF2S2 | chr20 | 32693351 | - |
| 102663 | CESC | TCGA-DS-A7WH-01A | ASXL1 | chr20 | 30956926 | + | EIF2S2 | chr20 | 32693351 | - |
| 102663 | BLCA | TCGA-XF-A8HG-01A | C20orf194 | chr20 | 3230807 | - | EIF2S2 | chr20 | 32680685 | - |
| 102663 | BLCA | TCGA-XF-A8HG-01A | C20orf194 | chr20 | 3231820 | - | EIF2S2 | chr20 | 32678408 | - |
| 102663 | READ | TCGA-AH-6903 | CBFA2T2 | chr20 | 32078107 | + | EIF2S2 | chr20 | 32693351 | - |
| 25750 | LUSC | TCGA-LA-A7SW | EIF2S2 | chr20 | 32678322 | - | ADRA1D | chr20 | 4202777 | - |
| 25750 | LUSC | TCGA-LA-A7SW | EIF2S2 | chr20 | 32681481 | - | ADRA1D | chr20 | 4202777 | - |
| 25750 | LUSC | TCGA-LA-A7SW-01A | EIF2S2 | chr20 | 32678323 | - | ADRA1D | chr20 | 4202777 | - |
| 93554 | BRCA | TCGA-C8-A273 | EIF2S2 | chr20 | 32699901 | - | DEFB123 | chr20 | 30037831 | + |
| 93554 | BRCA | TCGA-C8-A273-01A | EIF2S2 | chr20 | 32699902 | - | DEFB123 | chr20 | 30037832 | + |
| 93646 | N/A | BI862538 | EIF2S2 | chr20 | 32677246 | - | DENND1C | chr19 | 6471137 | - |
| 57030 | N/A | BU571077 | EIF2S2 | chr20 | 32700004 | - | ENSA | chr1 | 150595036 | - |
| 79996 | STAD | TCGA-MX-A666-01A | EIF2S2 | chr20 | 32691268 | - | HORMAD2 | chr22 | 30507785 | + |
| 79996 | STAD | TCGA-MX-A666-01A | EIF2S2 | chr20 | 32691268 | - | HORMAD2 | chr22 | 30514969 | + |
| 94346 | SKCM | TCGA-D3-A1Q9-06A | EIF2S2 | chr20 | 32681481 | - | KCNB1 | chr20 | 47927336 | - |
| 100913 | HNSC | TCGA-CX-7082-01A | EIF2S2 | chr20 | 32699902 | - | LETM2 | chr8 | 38245468 | + |
| 92699 | Non-Cancer | TCGA-IN-8462-11A | EIF2S2 | chr20 | 32699902 | - | MTHFD1L | chr6 | 151330955 | + |
| 101913 | HNSC | TCGA-BB-7866 | EIF2S2 | chr20 | 32686303 | - | NCOA6 | chr20 | 33331145 | - |
| 101913 | HNSC | TCGA-BB-7866-01A | EIF2S2 | chr20 | 32686304 | - | NCOA6 | chr20 | 33331145 | - |
| 90389 | N/A | AA470596 | EIF2S2 | chr20 | 32686983 | - | PDXDC1 | chr16 | 15147666 | - |
| 92287 | UCEC | TCGA-KP-A3W4-01A | EIF2S2 | chr20 | 32691268 | - | SKAP1 | chr17 | 46266862 | - |
| 94726 | N/A | BM837359 | EIF2S2 | chr20 | 32693234 | - | TP53I11 | chr11 | 44956305 | - |
| 102663 | PRAD | TCGA-KK-A7B0 | FAM101A | chr12 | 124458567 | + | EIF2S2 | chr20 | 32693351 | - |
| 102663 | READ | TCGA-DC-6156 | PPP4R1L | chr20 | 56884282 | - | EIF2S2 | chr20 | 32693351 | - |
| 102663 | N/A | AA074990 | PTCHD1 | chrX | 23355718 | + | EIF2S2 | chr20 | 32677237 | + |
| 102663 | BRCA | TCGA-C8-A273 | RALY | chr20 | 32581937 | + | EIF2S2 | chr20 | 32691371 | - |
| 102663 | STAD | TCGA-BR-A4QI-01A | RALY | chr20 | 32619410 | + | EIF2S2 | chr20 | 32693351 | - |
| 102663 | N/A | CB051177 | RNF219 | chr13 | 79228153 | - | EIF2S2 | chr20 | 32677249 | + |
| 102663 | UCEC | TCGA-AJ-A3I9-01A | UBE4B | chr1 | 10093752 | + | EIF2S2 | chr20 | 32693351 | - |
| 102670 | PRAD | TCGA-KK-A7B0-01A | ZNF664 | chr12 | 124458567 | + | EIF2S2 | chr20 | 32693351 | - |
Top |
|
| Kaplan-Meier plots with logrank tests of overall survival (OS) |
 |
| Cancer type | Translation factor | Coefficent | Hazard ratio | Wald test pval | Likelihool ratio pval | Logrank test pval | # samples |
Top |
|
| Differential gene expression between female and male. (Wilcoxon test, pval<0.05) |
 |
| Cancer type | Translation factor | pval | adj.p |
| KIRP | EIF2S2 | 0.0062855422949569 | 0.18 |
| LUAD | EIF2S2 | 0.0194184847159643 | 0.52 |
| KIRC | EIF2S2 | 0.0324994895974943 | 0.84 |
| LUSC | EIF2S2 | 0.0337059430229103 | 0.84 |
Top |
|
| Differential gene expression between young and old age groups (Wilcoxon test, pval<0.05) |
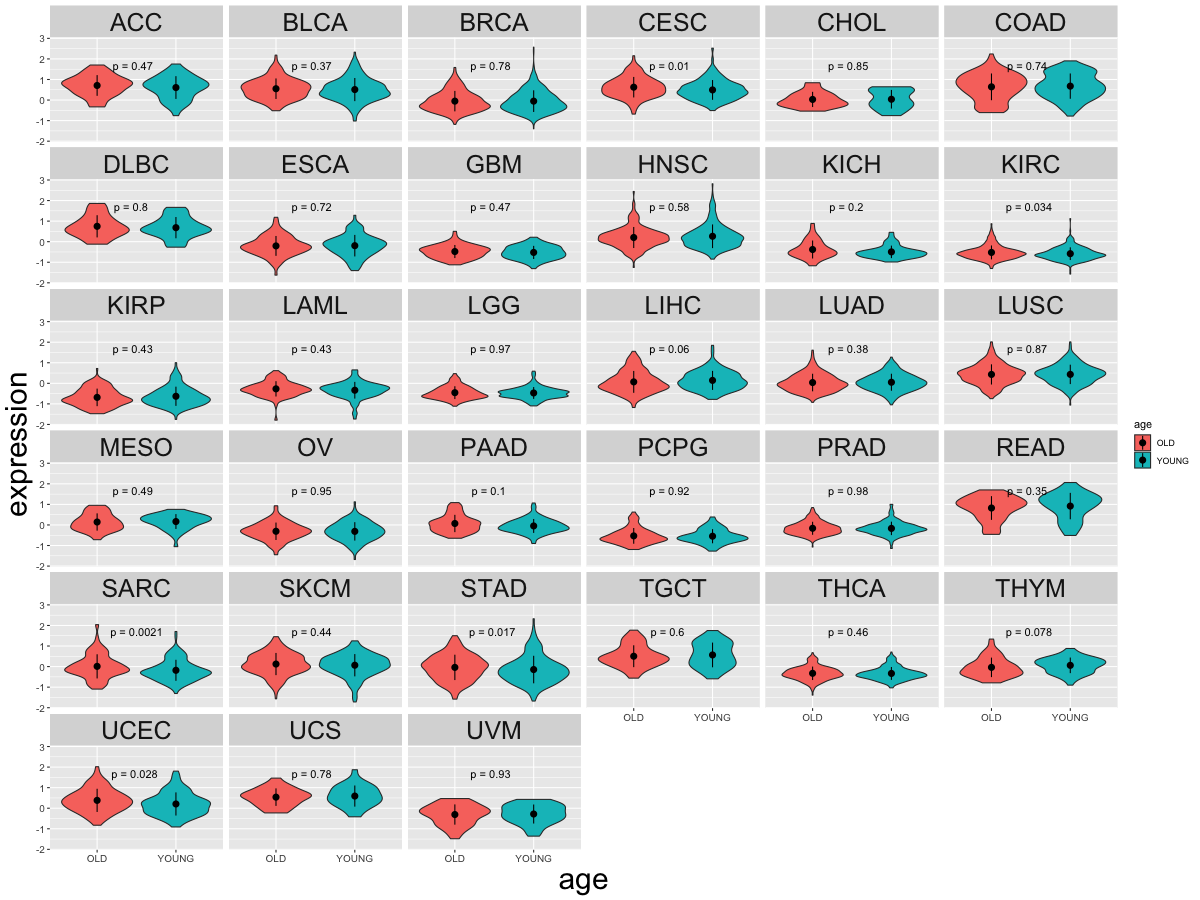 |
| Cancer type | Translation factor | pval | adj.p |
| STAD | EIF2S2 | 0.0172944213840682 | 0.54 |
| KIRC | EIF2S2 | 0.0340142596246009 | 0.99 |
| CESC | EIF2S2 | 0.0101540567575498 | 0.32 |
| UCEC | EIF2S2 | 0.0279557770527186 | 0.84 |
| SARC | EIF2S2 | 0.00207320600076442 | 0.068 |
Top |
|
| Drugs targeting genes involved in this translation factor. (DrugBank Version 5.1.8 2021-05-08) |
| UniProtAcc | DrugBank ID | Drug name | Drug activity | Drug type | Drug status |
Top |
|
| Diseases associated with this translation factor. (DisGeNet 4.0) |
| Disease ID | Disease Name | # PubMeds | Disease source |
| C0006142 | Malignant neoplasm of breast | 1 | CTD_human |
| C0678222 | Breast Carcinoma | 1 | CTD_human |
| C1257931 | Mammary Neoplasms, Human | 1 | CTD_human |
| C4704874 | Mammary Carcinoma, Human | 1 | CTD_human |
(UTHealth)
Web File Viewing | Emergency Information |Campus Carry|Site Policies