
|
||||||
|

Translation Factor: TGFBRAP1 (NCBI Gene ID:9392) |
|
 Gene Summary Gene Summary |
| Gene Information | Gene Name: TGFBRAP1 | Gene ID: 9392 | Gene Symbol | TGFBRAP1 | Gene ID | 9392 |
| Gene Name | transforming growth factor beta receptor associated protein 1 | |
| Synonyms | TRAP-1|TRAP1|VPS3 | |
| Cytomap | 2q12.1-q12.2 | |
| Type of Gene | protein-coding | |
| Description | transforming growth factor-beta receptor-associated protein 1TGF-beta receptor-associated protein 1VPS3 CORVET complex subunit | |
| Modification date | 20200313 | |
| UniProtAcc | . | |
| Child GO biological process term(s) under GO:0006412 |
| GO ID | GO term |
| Gene ontology of translaction factor with evidence of Inferred from Direct Assay (IDA) from Entrez |
| Partner | Gene | GO ID | GO term | PubMed ID |
| Hgene | TGFBRAP1 | GO:0006355 | regulation of transcription, DNA-templated | 11278302 |
| Hgene | TGFBRAP1 | GO:0007165 | signal transduction | 11278302 |
| Inferred gene age of translation factor. |
| Gene | Inferred gene age group among (0 - 67.6], (67.6 - 355.7], (355.7 - 733], (733 - 1119.25], >1119.25 |
Top |
|
| We searched PubMed using 'TGFBRAP1[title] AND translation [title] AND human.' |
| Gene | Title | PMID |
Top |
|
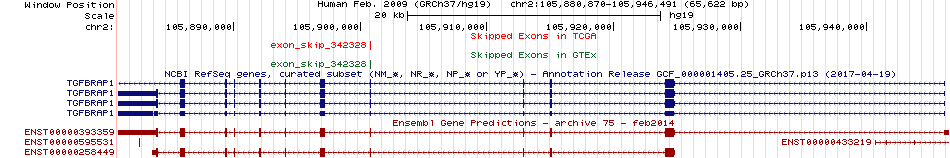
| Skipped exons in TCGA and GTEx based on Ensembl gene isoform structure. * Click on the image to open the UCSC genome browser with custom track showing this image in a new window. For more annotations, please visit our ExonSkipDB. |
 |
| Open reading frame (ORF) analsis of exon skipping events based on Ensembl gene isoform structure. * Click on the break point to see the gene structure around the break point region using the UCSC Genome Browser. |
| ENST | Exon skip start (DNA) | Exon Skip end (DNA) | ORF |
| Exon skipping position in the amino acid sequence. |
| ENST | Exon skip start (DNA) | Exon Skip end (DNA) | Len(transcript seq) | Exon skip start (mRNA) | Exon Skip end (mRNA) | Len(amino acid seq) | Exon skip start (AA) | Exon Skip end (AA) |
| Potentially (partially) lost protein functional features of UniProt. |
| UniProtAcc | Exon skip start (AA) | Exon Skip end (AA) | Function feature start (AA) | Function feature end (AA) | Functional feature type | Functional feature desc. |
Top |
|
| Gene expression level across TCGA pancancer |
| Gene expression level across GTEx pantissue |
| Expression level of gene isoforms across TCGA pancancer |
| Expression level of gene isoforms across GTEx pantissue |
| Cancer(tissue) type-specific expression level of Translation factor using z-score distriution |
| Differential expression between tumor and matched normal (in the cancer types with more than 10 matched samples) |
| Cancer type | Translation factor | FC | adj.pval |
| COAD | TGFBRAP1 | 1.13287389604466 | 0.000524610280990601 |
Top |
|
| Translation factor expression regulation through miRNA binding |
| Cancer type | Gene | miRNA | TargetScan binding score (Context++ score percentile) | Coefficient | Pvalue |
| Translation factor expression regulation through methylation in the promoter of Translation factor |
| Cancer type | Gene | methyl group b | methyl group a | DEG pval | avg methyl in b | avg methyl in a | avg exp in b | avg exp in a |
| Translation factor expression regulation through methylation in the gene body of Translation factor (positive regulation) |
| Cancer type | Gene | methyl group b | methyl group a | DEG pval | avg methyl in b | avg methyl in a | avg exp in b | avg exp in a |
| Translation factor expression regulation through copy number variation of Translation factor |
| Cancer type | Gene | Coefficient | Pvalue |
Top |
|
| Strongly correlated genes belong to cellular important gene groups with TGFBRAP1 (coefficient>0.8, pval<0.05, node color based on FC between tumor and matched normal). Significantly associated important genes in the individual cancer types. * Cell metabolism gene: cell metabolism genes from REACTOME (black edge), IUPHAR: drug target genes from IUPHAR (blue edge), Kinase: human kinase genes (brown edge), CGC: cancer gene census genes (orange edge), TSG: tumor suppresor genes (purple edge), Epifactor: epigenetic factors (light blue edge), TF: transcription factors (green) |
| Cancer type | Gene group | Translation factor | Correlated gene | Coefficient | Pvalue |
Top |
|
| Protein 3D structure Visit iCn3D. |
Top |
|
| Protein-protein interaction networks * Overlap between up-regulated DEGs (log2FC<-1 and adj.P<0.05) and STRING PPI network (center: Translation factor, node: DEGs, edges: weighted by -log2(adj.P)) |
| Overlap between down-regulated DEGs (log2FC>1 and adj.P<0.05) and STRING PPI network (center: Translation factor, node: DEGs, edges: weighted by -log2(adj.P)) |
 * Edge colors based on TCGA cancer types. |
| * Overlap between DEGs (log2FC>1 and adj.P<0.05) and STRING PPI network per cancer (center: Translation factor, node: DEGs, node color: log2FC, edges: weighted by -log2(adj.P)) |
| Cancer type | Translation factor | Interacting protein coding gene | FC | adj.pval |
| Protein-protein interactors with this translation factor (BIOGRID-3.4.160) |
| PPI interactors with TGFBRAP1 |
Top |
|
| Clinically associated variants from ClinVar. |
| Gene | Chr | Position | RefSeq | VarSeq | RefSeeq | VarType | Pathogenic | Disease | VarInfo |
| nsSNVs with sample frequency (size of circle) from TCGA 33 cancers. |
| SNVs and Indels |
| Gene | Cancer type | Chromosome | Start | End | RefSeeq | MutSeq | Mutation type | AAchange | # samples |
| Copy number variation (CNV) of TGFBRAP1 * Click on the image to open the original image in a new window. |
 |
| Fusion gene breakpoints (product of the structural variants (SVs)) across TGFBRAP1 * Click on the image to open the UCSC genome browser with custom track showing this image in a new window. |
 |
| Fusion genes with this translation factor from FusionGDB2.0. |
| FusionGDB2 ID | Disease | Sample | Hgene | Hchr | Hbp | Hstrand | Tgene | Tchr | Tbp | Tstrand |
| 91637 | N/A | N29143 | METTL1 | chr12 | 58164458 | - | TGFBRAP1 | chr2 | 105894262 | - |
| 91637 | N/A | EC513041 | NLRP1 | chr17 | 5459772 | + | TGFBRAP1 | chr2 | 105921172 | + |
| 95672 | N/A | EC581145 | TGFBRAP1 | chr2 | 105866319 | + | AAGAB | chr15 | 67494510 | - |
| 100867 | SARC | TCGA-DX-AB2O-01A | TGFBRAP1 | chr2 | 105885729 | - | ARHGAP15 | chr2 | 144193170 | + |
| 95510 | HNSC | TCGA-CV-5431-01A | TGFBRAP1 | chr2 | 105912813 | - | CCDC146 | chr7 | 76866264 | + |
| 90494 | SARC | TCGA-DX-A8BU-01A | TGFBRAP1 | chr2 | 105912813 | - | DPP10 | chr2 | 115464694 | + |
| 90494 | SARC | TCGA-DX-AB2J-01A | TGFBRAP1 | chr2 | 105912813 | - | DPP10 | chr2 | 116066815 | + |
| 97829 | LUAD | TCGA-38-4630 | TGFBRAP1 | chr2 | 105912812 | - | FHL2 | chr2 | 106002997 | - |
| 97829 | LUAD | TCGA-38-4630-01A | TGFBRAP1 | chr2 | 105912813 | - | FHL2 | chr2 | 106002997 | - |
| 90494 | N/A | AF075587 | TGFBRAP1 | chr2 | 105883153 | + | MYCBP2 | chr13 | 77901177 | - |
| 102045 | N/A | BC010093 | TGFBRAP1 | chr2 | 105889455 | - | RPLP2 | chr11 | 810003 | + |
| 95170 | OV | TCGA-13-1505-01A | TGFBRAP1 | chr2 | 105912813 | - | RQCD1 | chr2 | 219447694 | + |
| 91638 | BRCA | TCGA-EW-A1PC-01B | TMEM131 | chr2 | 98475767 | - | TGFBRAP1 | chr2 | 105897180 | - |
Top |
|
| Kaplan-Meier plots with logrank tests of overall survival (OS) |
| Cancer type | Translation factor | Coefficent | Hazard ratio | Wald test pval | Likelihool ratio pval | Logrank test pval | # samples |
Top |
|
| Differential gene expression between female and male. (Wilcoxon test, pval<0.05) |
| Cancer type | Translation factor | pval | adj.p |
Top |
|
| Differential gene expression between young and old age groups (Wilcoxon test, pval<0.05) |
| Cancer type | Translation factor | pval | adj.p |
Top |
|
| Drugs targeting genes involved in this translation factor. (DrugBank Version 5.1.8 2021-05-08) |
| UniProtAcc | DrugBank ID | Drug name | Drug activity | Drug type | Drug status |
Top |
|
| Diseases associated with this translation factor. (DisGeNet 4.0) |
| Disease ID | Disease Name | # PubMeds | Disease source |
(UTHealth)
Web File Viewing | Emergency Information |Campus Carry|Site Policies